Open Access
Fig. 3
Download original image
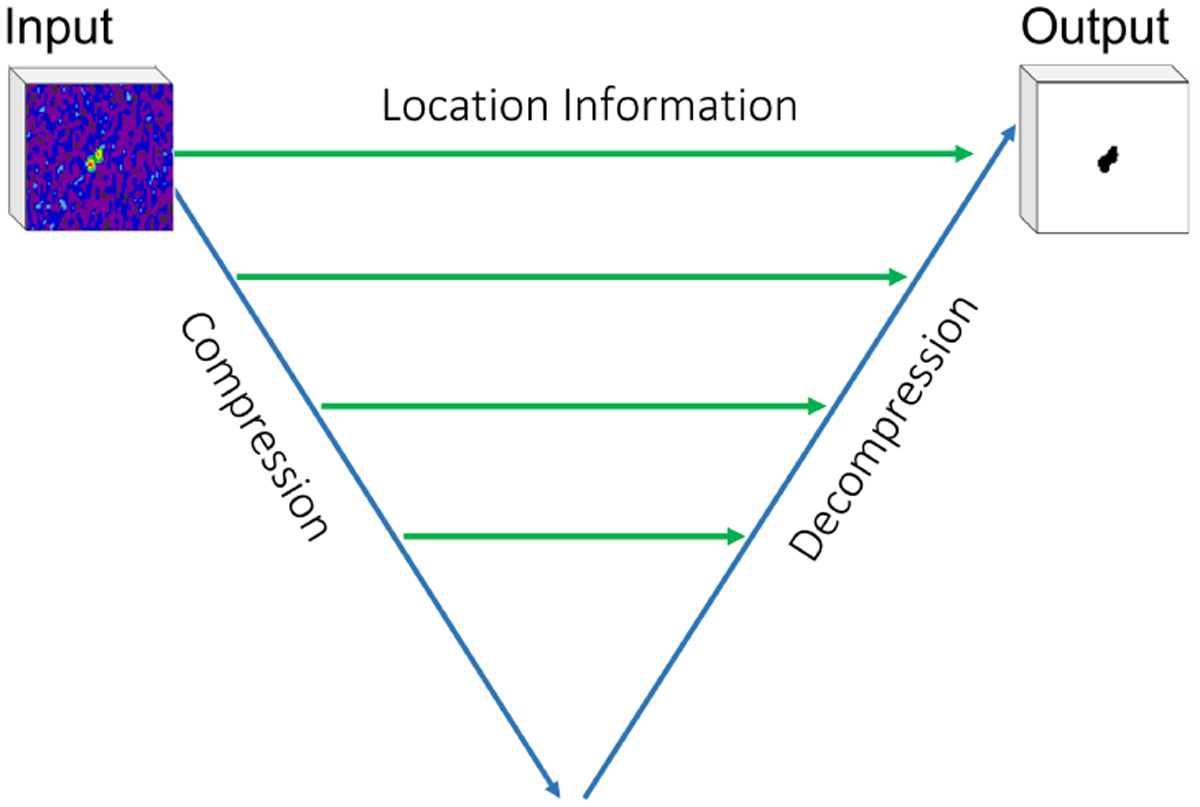
Illustration of the V-Net architecture, based on the architecture of Milletari et al. (2016). The compression path is shown on the left and the decompression path on the right, and the two are horizontally linked by the location information.
Current usage metrics show cumulative count of Article Views (full-text article views including HTML views, PDF and ePub downloads, according to the available data) and Abstracts Views on Vision4Press platform.
Data correspond to usage on the plateform after 2015. The current usage metrics is available 48-96 hours after online publication and is updated daily on week days.
Initial download of the metrics may take a while.