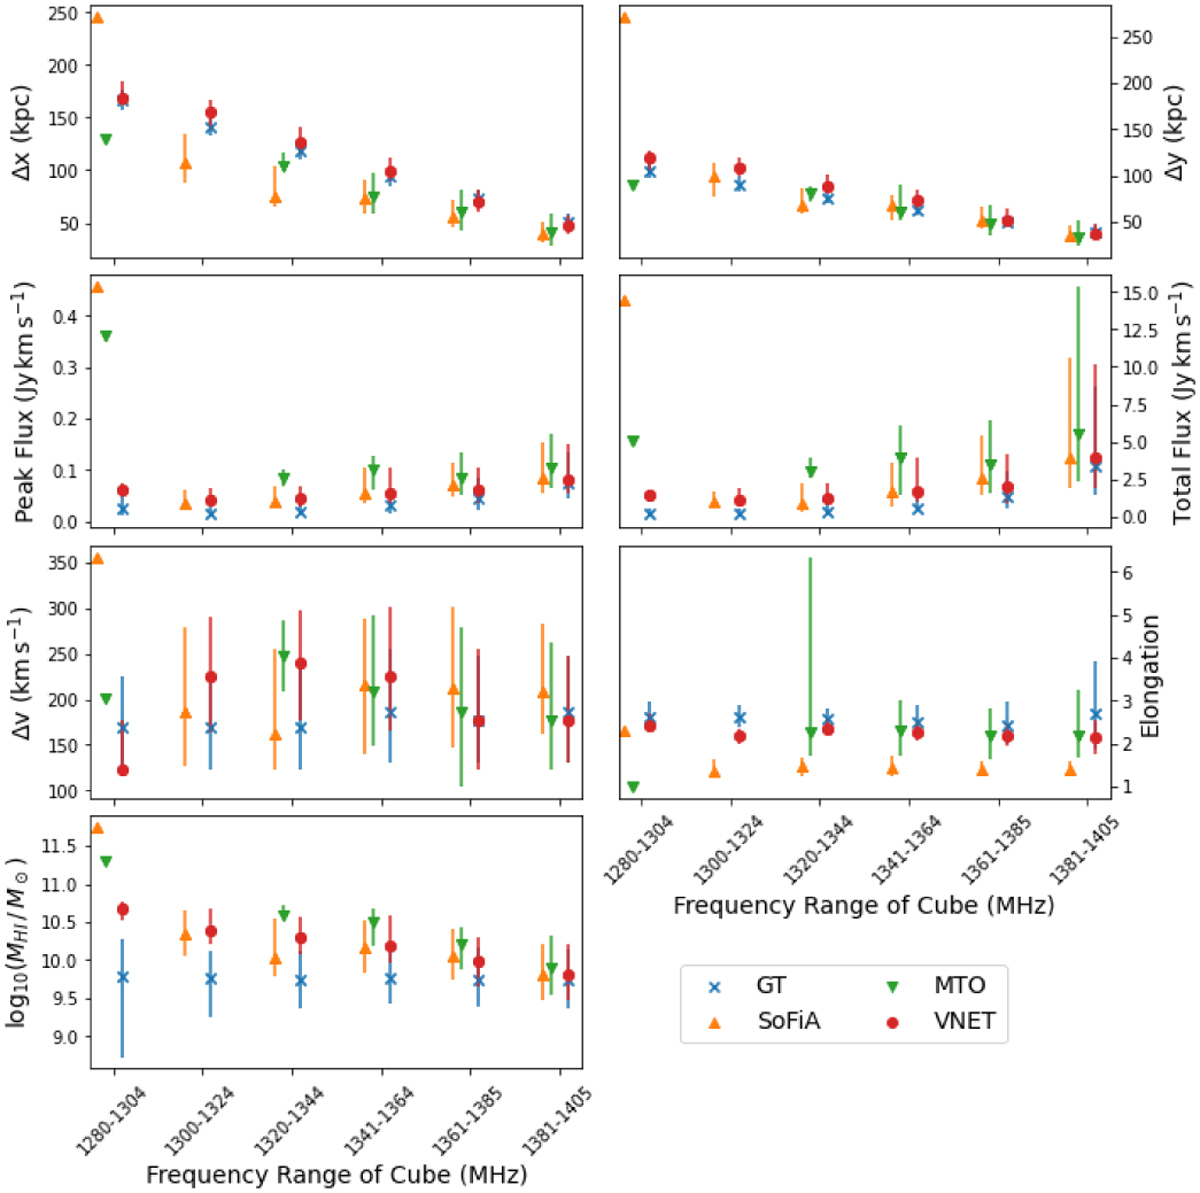
Fig. 10
Download original image
25th, 50th, and 75th percentiles of the physical properties of the masked mock galaxies detected by each method per spectral window. For all the plots the x-axis shows the frequency range associated with each spectral window, and the markers indicate the median or 50th percentile. The orange triangles show the detections of SoFiA, the green triangles show the detections of MTO, the red circles show the detections of the V-Net network, and the blue crosses show the ground truth masks. The lines below and above each marker indicate the 25th and 75th percentiles, respectively. The top panel shows the two spatial dimensions, Δx and Δy, in kpc, the second panel shows the peak flux and the total flux, the third panel shows the velocity width, Δv, in km s−1 and the spatial elongation, and the last panel shows the log of the H I mass.
Current usage metrics show cumulative count of Article Views (full-text article views including HTML views, PDF and ePub downloads, according to the available data) and Abstracts Views on Vision4Press platform.
Data correspond to usage on the plateform after 2015. The current usage metrics is available 48-96 hours after online publication and is updated daily on week days.
Initial download of the metrics may take a while.