Open Access
Fig. 8.
Download original image
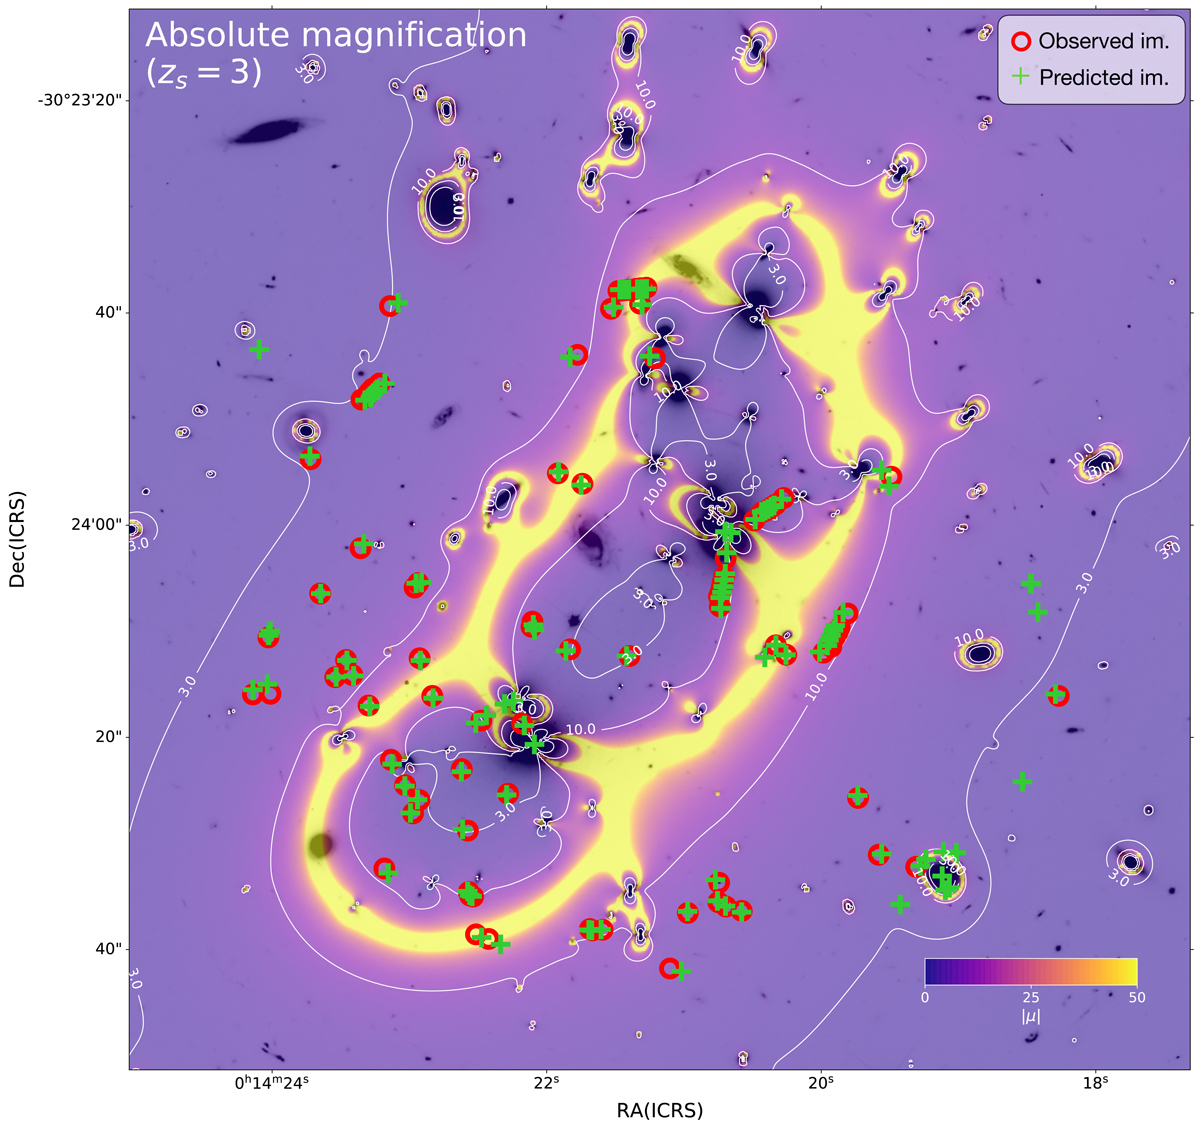
Absolute magnification map computed for a source at redshift zs = 3. Isomagnification contours for |μ| equal to 3.0 and 10.0 are plotted in white. The red circles indicated the observed positions of the 90 multiple images, while the green crosses show the predicted positions obtained with our best-fit LM-model.
Current usage metrics show cumulative count of Article Views (full-text article views including HTML views, PDF and ePub downloads, according to the available data) and Abstracts Views on Vision4Press platform.
Data correspond to usage on the plateform after 2015. The current usage metrics is available 48-96 hours after online publication and is updated daily on week days.
Initial download of the metrics may take a while.