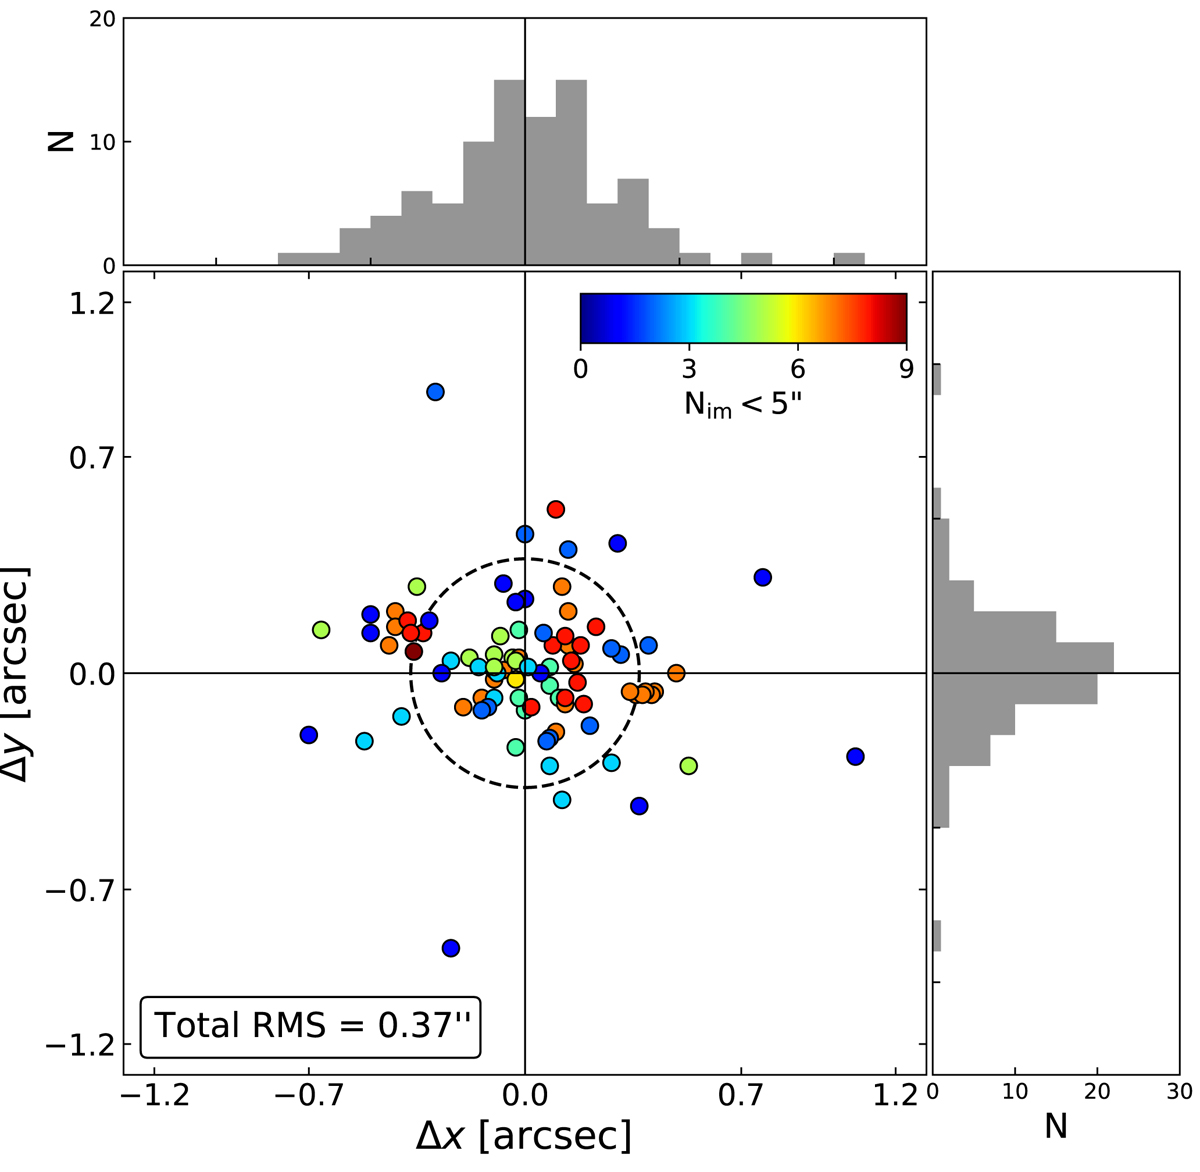
Fig. 6.
Download original image
Displacements Δi (see Eq. (2)) along the x and y directions of the 90 observed multiple images used to optimize the reference lens model described in this work, color-coded according to the spatial density of the images within 5″. The dashed black circle indicates the total Δrms value of ![]() . The histograms show the displacement distribution along each direction, also illustrating the goodness of the model.
. The histograms show the displacement distribution along each direction, also illustrating the goodness of the model.
Current usage metrics show cumulative count of Article Views (full-text article views including HTML views, PDF and ePub downloads, according to the available data) and Abstracts Views on Vision4Press platform.
Data correspond to usage on the plateform after 2015. The current usage metrics is available 48-96 hours after online publication and is updated daily on week days.
Initial download of the metrics may take a while.