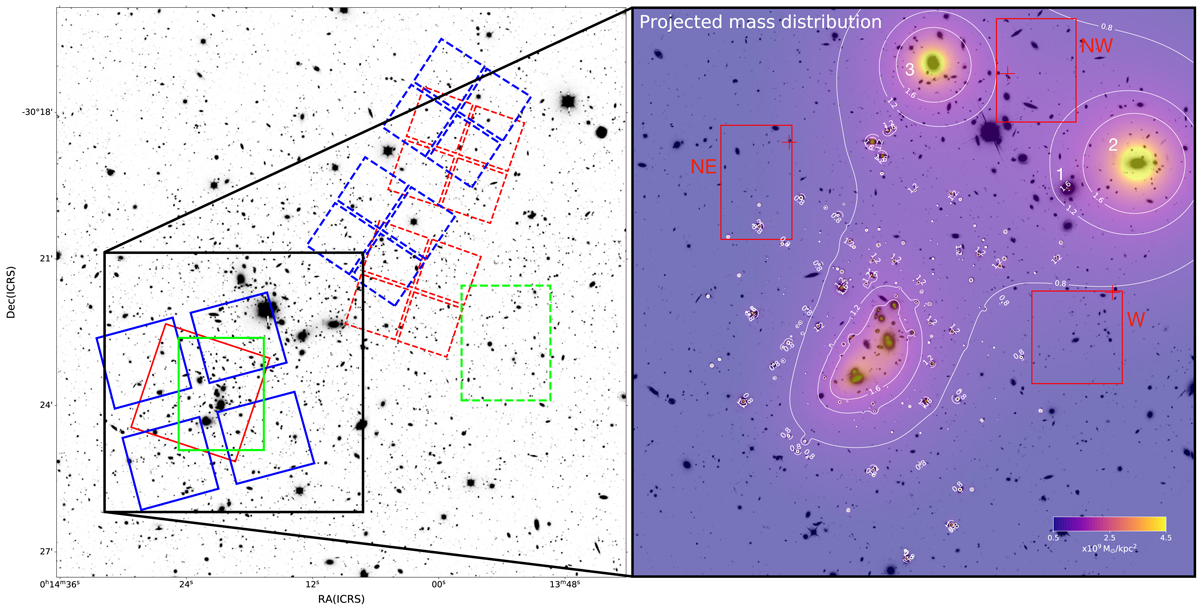
Fig. 5.
Download original image
Projected total mass density distribution of the galaxy cluster A2744 obtained from the LM-model. Left: Magellan R-band imaging of A2744 with the JWST footprints from the GLASS-JWST-ERS program, as also shown in Fig. 1 from Treu et al. (2022). In red and blue, we show the footprints of the NIRISS and NIRSpec pointings, respectively, while in green we plot the HFF central pointing of the cluster and the parallel field (dashed). Dashed lines correspond to parallel NIRCam pointings. Right: total projected mass distribution obtained from the best-fit LM-model, in units of 109 M⊙ kpc−2, overlaid on the HST/F814W image. Isodensity contours corresponding to [0.8, 1.2, 1.6] ×109 M⊙/kpc2 are plotted in white. The red rectangles indicate the assumed priors for the positions of the three WL clumps from Medezinski et al. (2016), while the red crosses show the obtained best-fit positions. The numbers 1, 2, and 3 refer to the first, second, and third external clumps (see Table 1).
Current usage metrics show cumulative count of Article Views (full-text article views including HTML views, PDF and ePub downloads, according to the available data) and Abstracts Views on Vision4Press platform.
Data correspond to usage on the plateform after 2015. The current usage metrics is available 48-96 hours after online publication and is updated daily on week days.
Initial download of the metrics may take a while.