Fig. 4.
Download original image
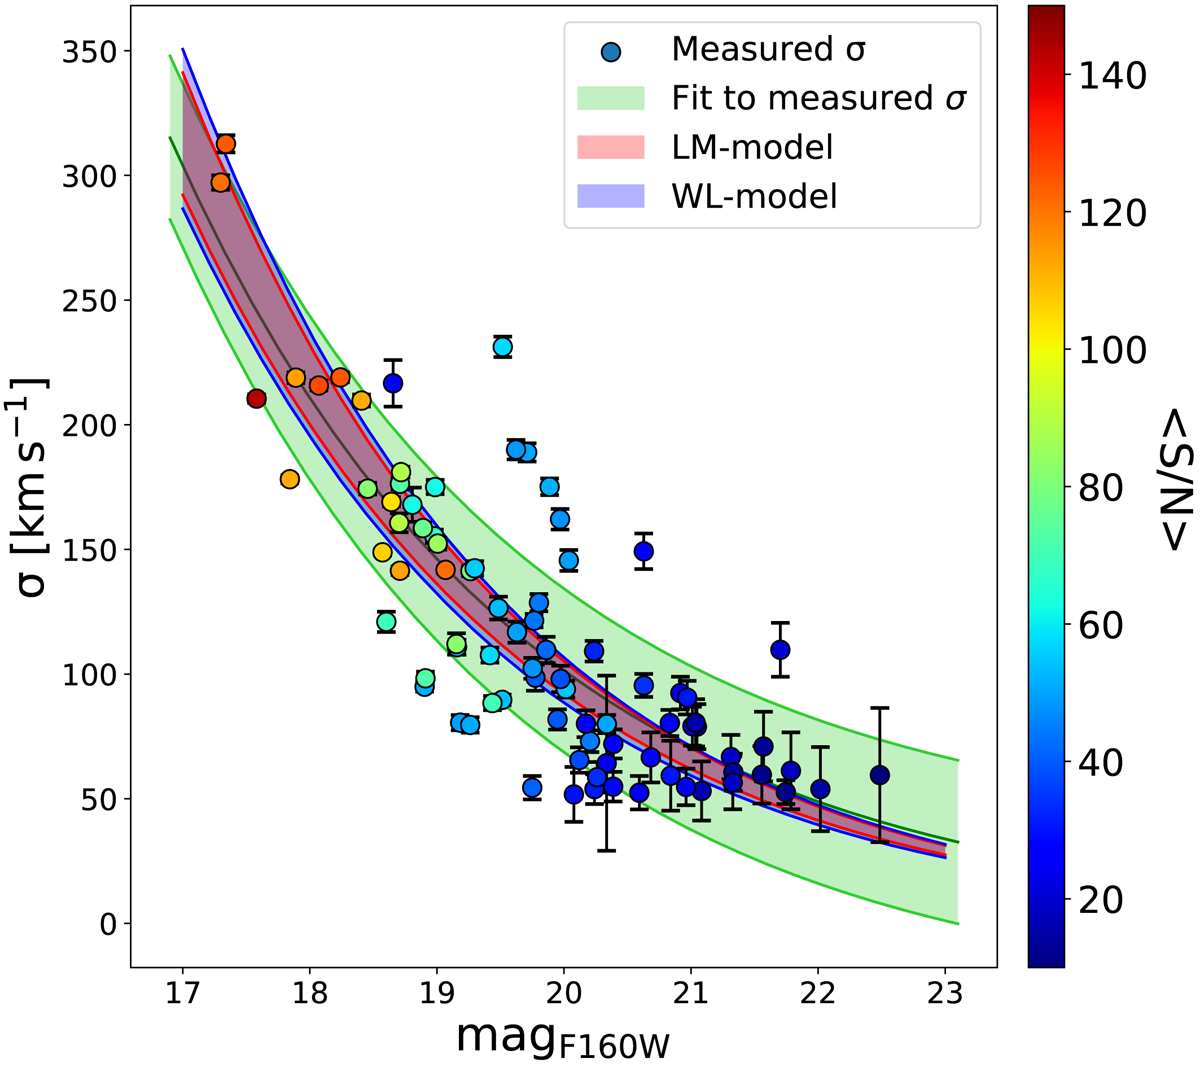
Measured internal stellar velocity dispersions of 85 cluster galaxies as a function of their magnitudes in the HST/F160W band are shown as filled circles, color-coded according to the mean signal-to-noise ratio of the galaxy spectra. The green line and filled area correspond to best-fit and the associated mean scatter of the σ − mF160W relation, respectively (see Sect. 3.2). The red and blue areas correspond to the 68% confidence level of the σ − mF160W relation obtained from the reference LM-model and the WL-model, respectively.
Current usage metrics show cumulative count of Article Views (full-text article views including HTML views, PDF and ePub downloads, according to the available data) and Abstracts Views on Vision4Press platform.
Data correspond to usage on the plateform after 2015. The current usage metrics is available 48-96 hours after online publication and is updated daily on week days.
Initial download of the metrics may take a while.