Open Access
Fig. 3.
Download original image
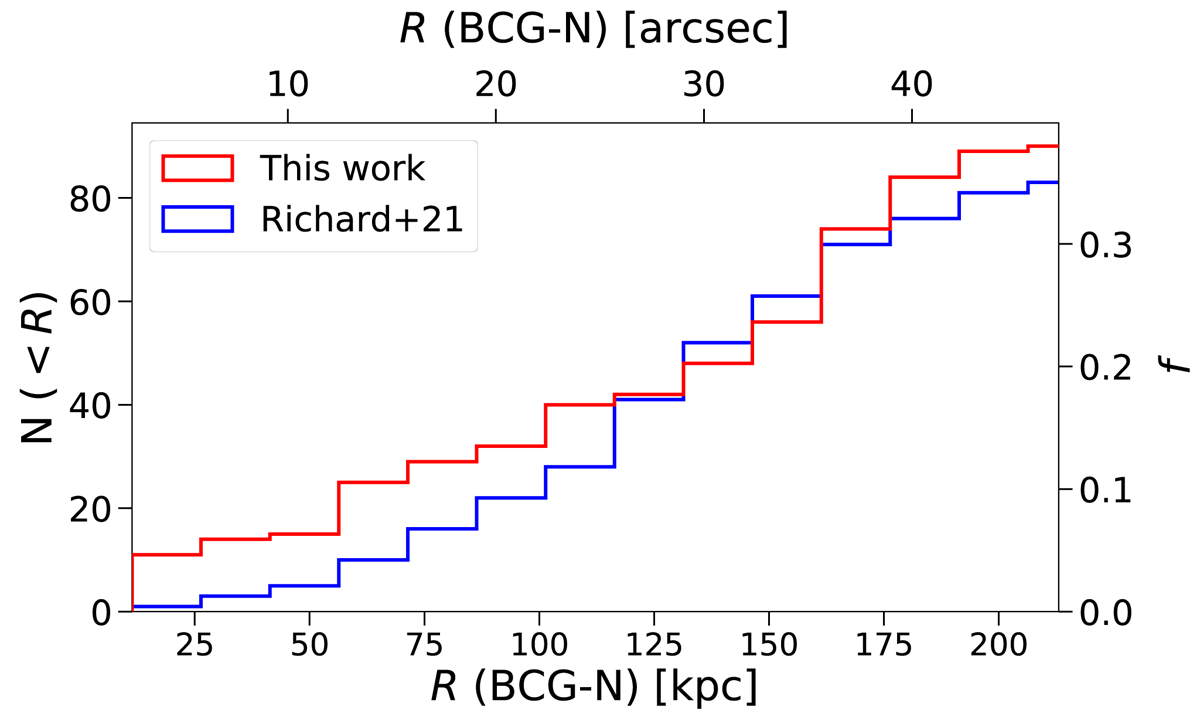
Cumulative distributions of the distances of the multiple images from BCG-N of A2744. In red is the distribution of the images used as constraints in this work (90 multiple images in total) and in blue is the distribution of the images used in R21.
Current usage metrics show cumulative count of Article Views (full-text article views including HTML views, PDF and ePub downloads, according to the available data) and Abstracts Views on Vision4Press platform.
Data correspond to usage on the plateform after 2015. The current usage metrics is available 48-96 hours after online publication and is updated daily on week days.
Initial download of the metrics may take a while.