Fig. 2.
Download original image
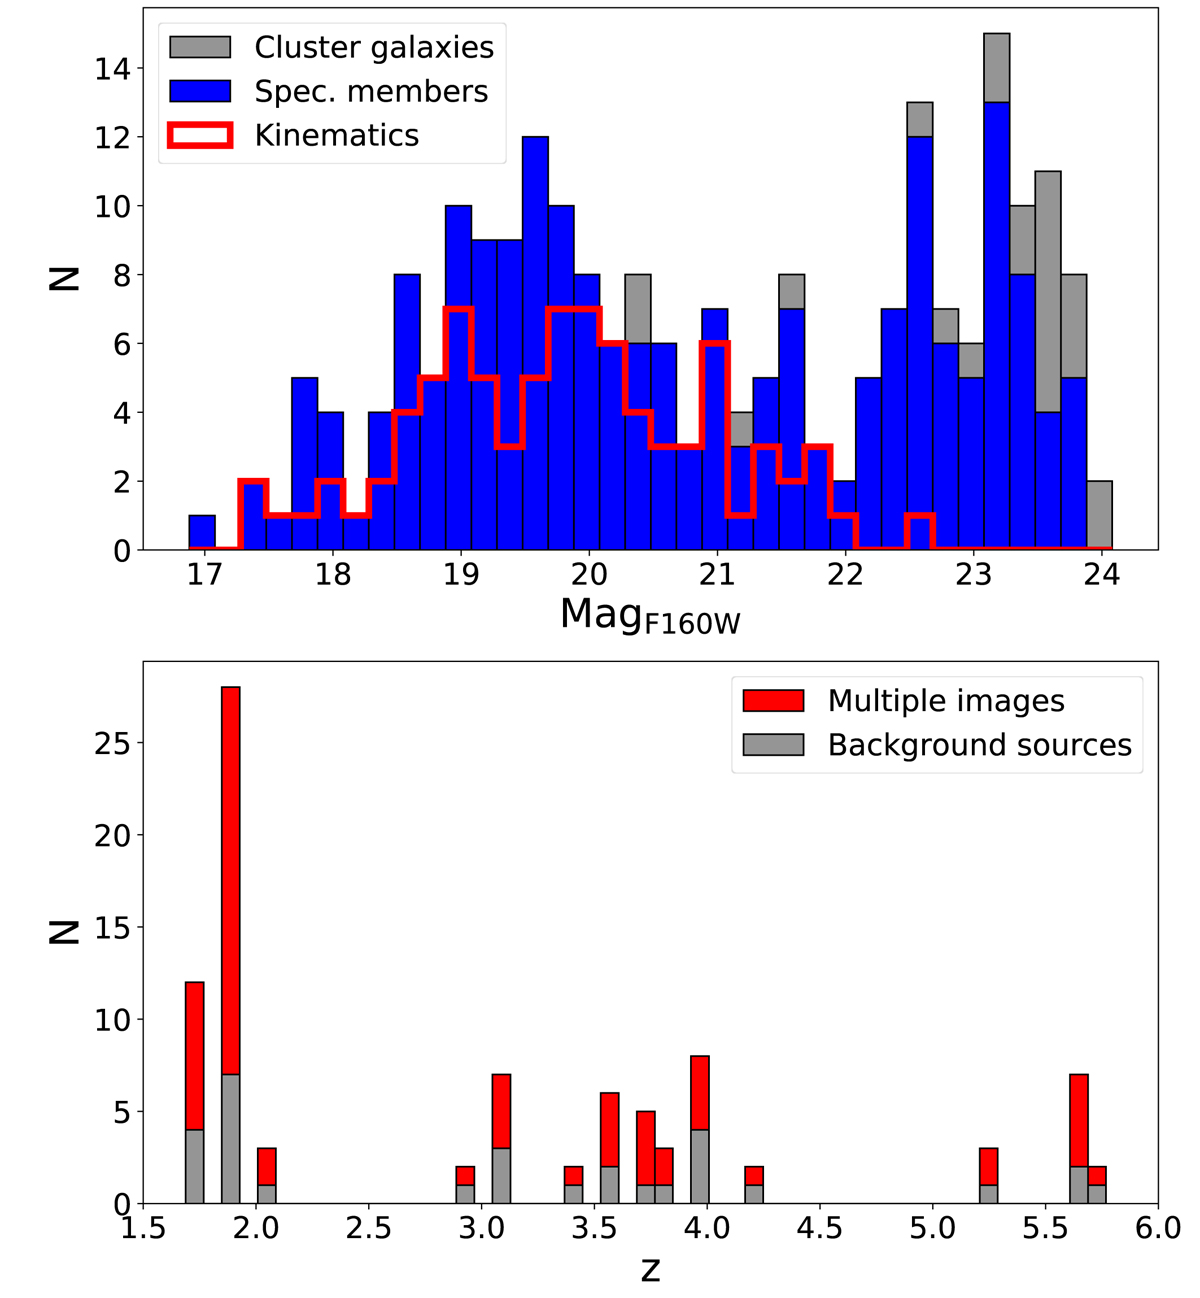
Magnitude and redshift distributions of the cluster member galaxies and multiple images considered in the lens models. Top: distribution of cluster member galaxies as a function of their magnitudes in the HST/F160W filter. The photometric sample of cluster members used in our lens model is plotted in gray, with the spectroscopic members pictured in blue. Cluster members with a reliable measurement of their internal stellar velocity dispersion are highlighted in red. Bottom: redshift distribution of the observed 90 multiple images used to constrain the reference lens model described in this work.
Current usage metrics show cumulative count of Article Views (full-text article views including HTML views, PDF and ePub downloads, according to the available data) and Abstracts Views on Vision4Press platform.
Data correspond to usage on the plateform after 2015. The current usage metrics is available 48-96 hours after online publication and is updated daily on week days.
Initial download of the metrics may take a while.