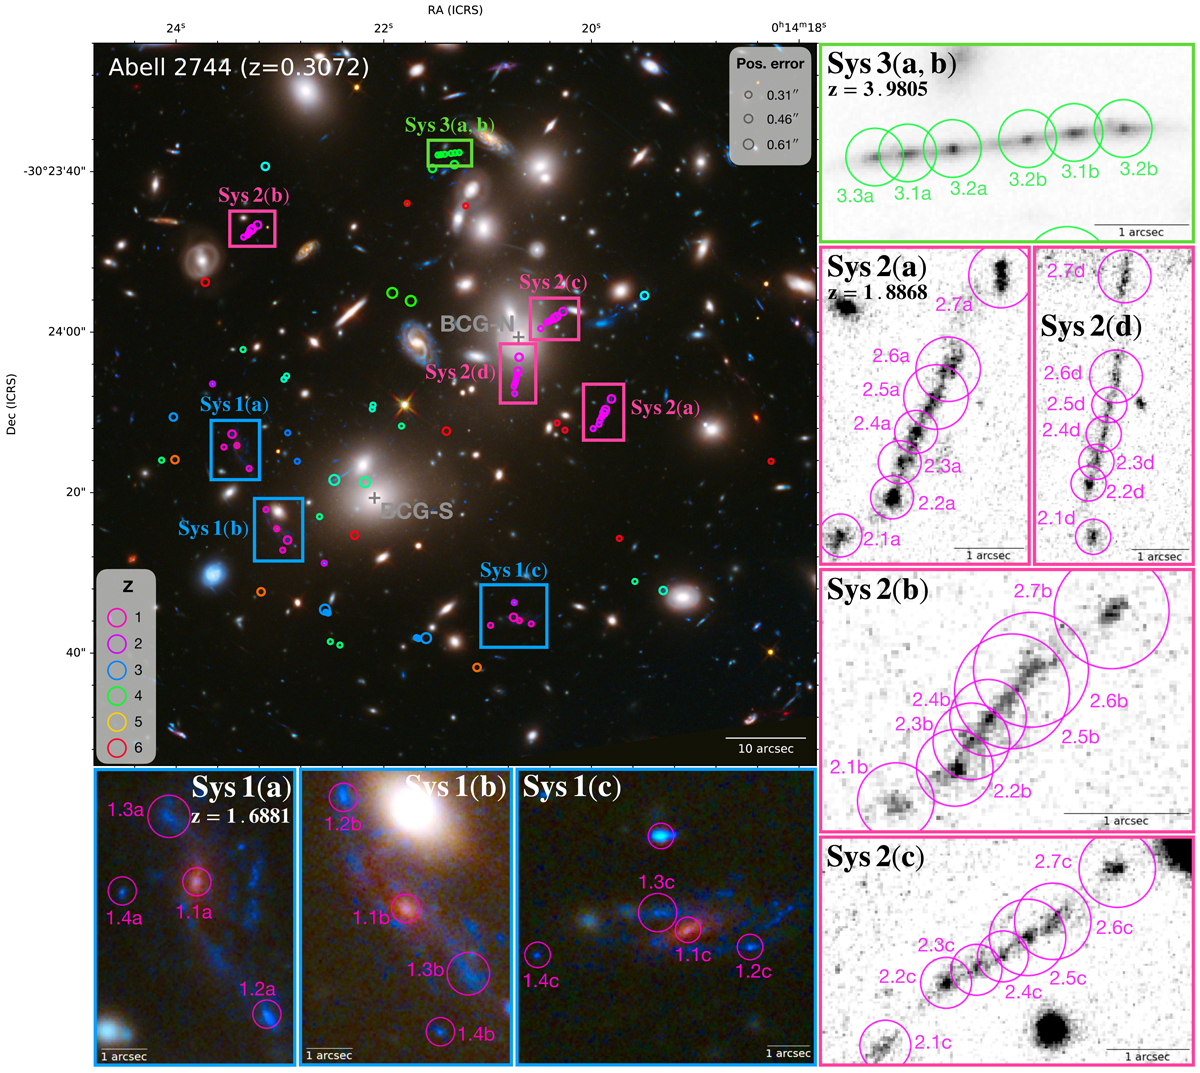
Fig. 1.
Download original image
Color-composite RGB image of A2744 (credits: https://esahubble.org/images/heic1401a/). Circles show the positions of the 90 spectroscopically confirmed multiple images included in the SL model, color-coded according to their redshift value. The size of the circle illustrates the adopted (rescaled) positional error in the modeling. Colored squares highlight the systems of multiple images for which additional lensed clumps have been identified. The two BCGs (BCG-N and BCG-S) are labeled in gray.
Current usage metrics show cumulative count of Article Views (full-text article views including HTML views, PDF and ePub downloads, according to the available data) and Abstracts Views on Vision4Press platform.
Data correspond to usage on the plateform after 2015. The current usage metrics is available 48-96 hours after online publication and is updated daily on week days.
Initial download of the metrics may take a while.