Fig. 8.

Download original image
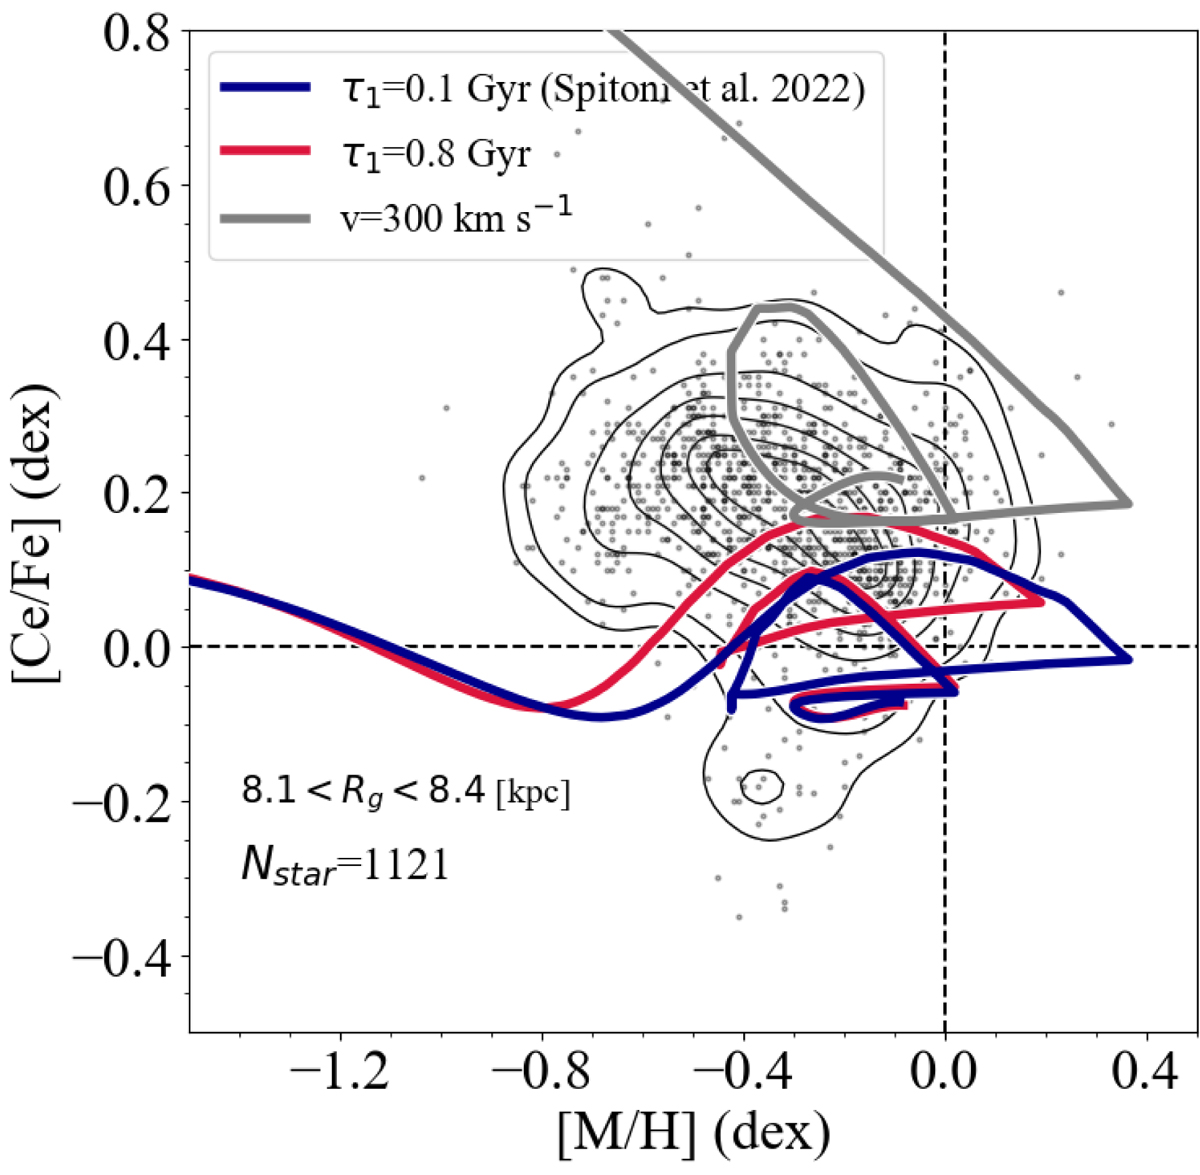
Model predictions for the chemical evolution of Ce in the [Ce/Fe] vs. [M/H] plane (high-quality sample). The blue line stands for the model assuming the same parameter as in Spitoni et al. (2023, see their Table 2). In this case, the timescale of the gas accretion for the high-α sequence is τ1 = 0.1 Gyr. The red line shows the case with τ1 = 0.8 Gyr. The grey line represents the model where the yields of Limongi & Chieffi (2018) for rotating massive stars assuming that all stars rotate with an initial velocity of 300 km s−1 have been considered. GSP-Spec stars with guiding radii Rg between 8.1 and 8.4 kpc are indicated with grey points. The contour lines enclose fractions of 0.95, 0.90, 0.75, 0.60, 0.45, 0.30, 0.20, and 0.05 of the total number of observed stars.
Current usage metrics show cumulative count of Article Views (full-text article views including HTML views, PDF and ePub downloads, according to the available data) and Abstracts Views on Vision4Press platform.
Data correspond to usage on the plateform after 2015. The current usage metrics is available 48-96 hours after online publication and is updated daily on week days.
Initial download of the metrics may take a while.


