Fig. 7.
Download original image
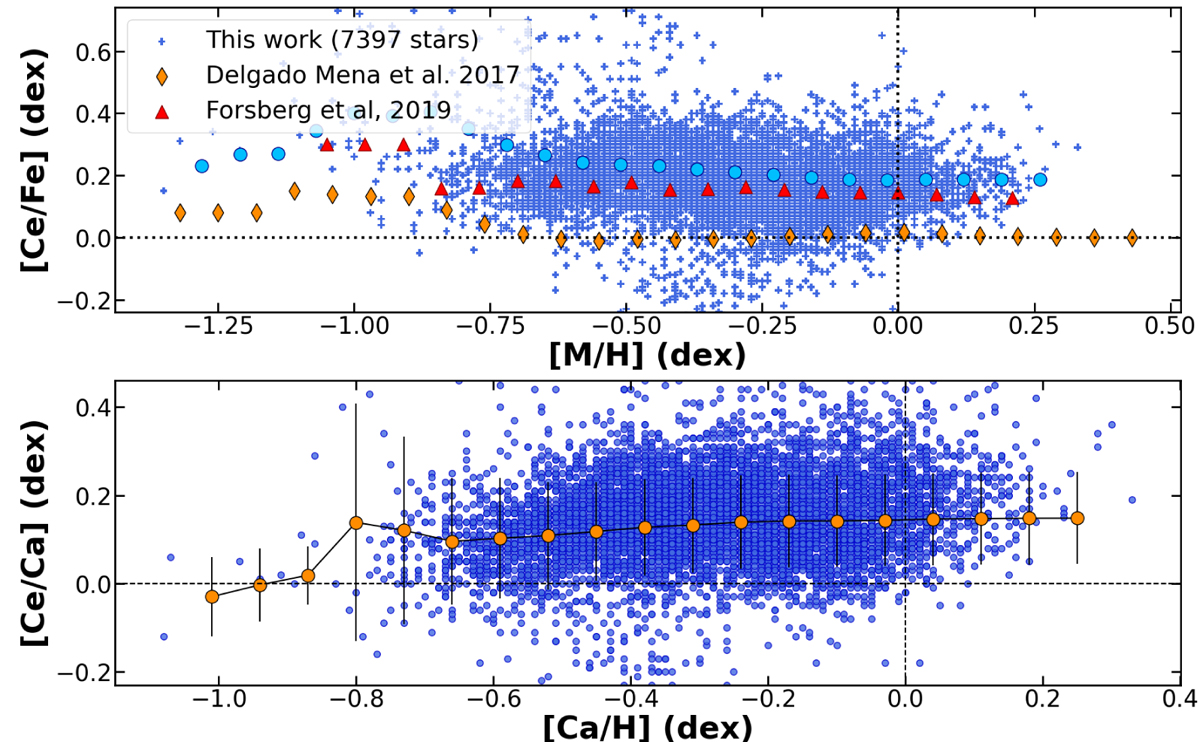
Top panel: cerium and iron abundances ratio for the high-quality sample with respect to the metallicity. Red triangles and orange diamonds are mean [Ce/Fe] ratios for the stars of F19 and Delgado Mena et al. (2017), respectively (computed per bins of 0.07 dex). Sky blue points the mean of our data per bin of 0.07 dex in [Ca/H]. Bottom panel: [Ce/Ca] vs. [M/H]. Orange dots correspond to the mean of the measurements per bin of 0.07 dex, and the error bars correspond to the standard deviation in each bin.
Current usage metrics show cumulative count of Article Views (full-text article views including HTML views, PDF and ePub downloads, according to the available data) and Abstracts Views on Vision4Press platform.
Data correspond to usage on the plateform after 2015. The current usage metrics is available 48-96 hours after online publication and is updated daily on week days.
Initial download of the metrics may take a while.