Fig. 5.
Download original image
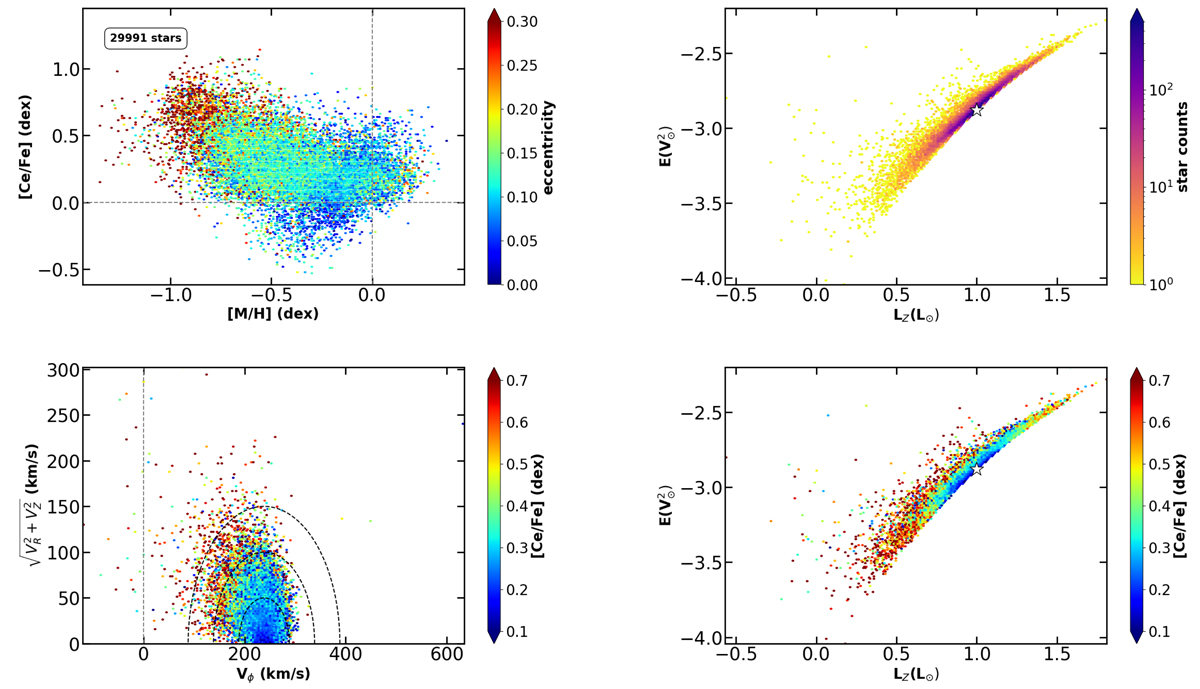
Left upper panel: distribution of cerium vs. metallicity for the low-uncertainty sample stars, colour-coded with the eccentricity of their orbits. Left lower panel: Toomre diagram colour-coded with [Ce/Fe]. The circular dashed lines corresponds to VTot = 50, 100 and 150 km s−1. Right panels: Energy-angular momentum (E, LZ) plane colour-coded by density (top panel), and medium cerium abundance (lower panel). The white star indicates the solar neighbourhood (LZ = L⊙, ![]() ).
).
Current usage metrics show cumulative count of Article Views (full-text article views including HTML views, PDF and ePub downloads, according to the available data) and Abstracts Views on Vision4Press platform.
Data correspond to usage on the plateform after 2015. The current usage metrics is available 48-96 hours after online publication and is updated daily on week days.
Initial download of the metrics may take a while.