Fig. 2.
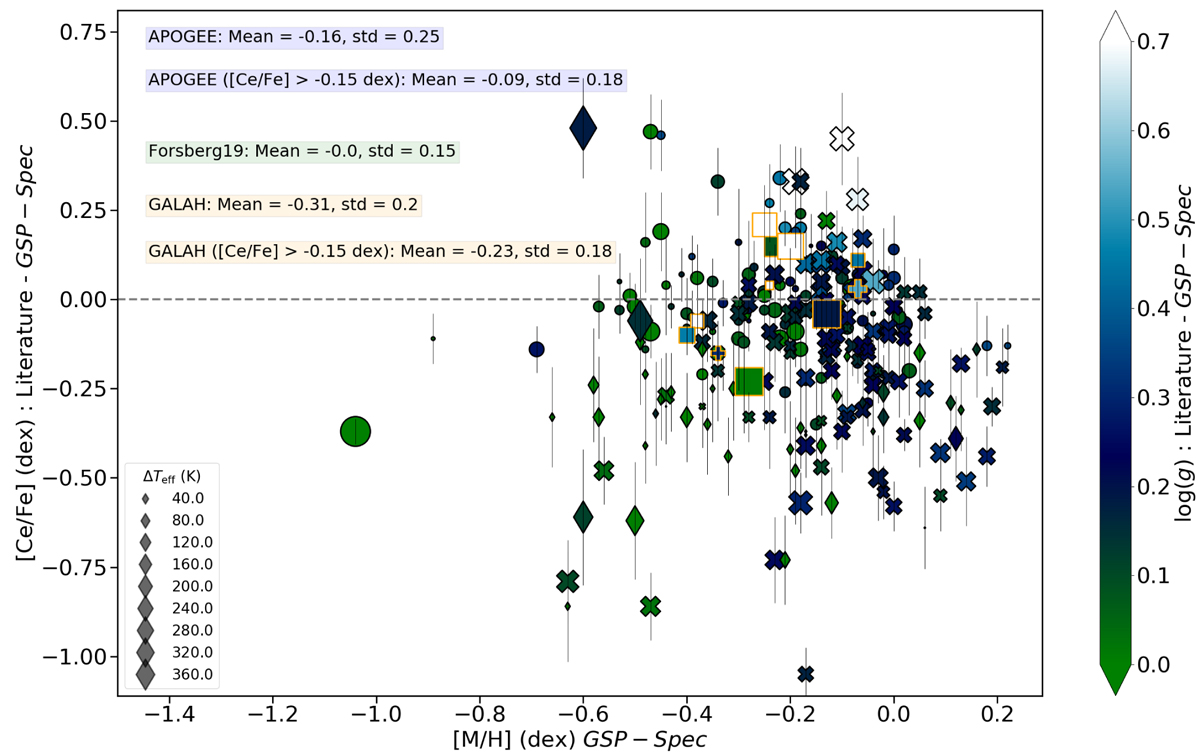
Download original image
Comparison between GSP-Spec low-uncertainty sample cerium abundance and literature values as a function of the GSP-Spec metallicity (crosses refer to APOGEE data, circles to F19, and diamonds to GALAH. Squares and plus markers refer to the nine and two stars in common between the strict sample and F19 and APOGEE, respectively). The points are colour-coded with the difference in log(g), and their size is proportional to differences in Teff. The vertical error bars indicate the uncertainty of GSP-Spec Ce abundance. The mean and the standard deviation of the cerium abundance differences between GSP-Spec and F19 are also given. For APOGEE and GALAH, we provide similar statistics differences for the whole comparison sample and when only their stars with [Ce/Fe] > −0.15 dex are considered. We used calibrated GSP-Spec and APOGEE atmospheric parameters.
Current usage metrics show cumulative count of Article Views (full-text article views including HTML views, PDF and ePub downloads, according to the available data) and Abstracts Views on Vision4Press platform.
Data correspond to usage on the plateform after 2015. The current usage metrics is available 48-96 hours after online publication and is updated daily on week days.
Initial download of the metrics may take a while.