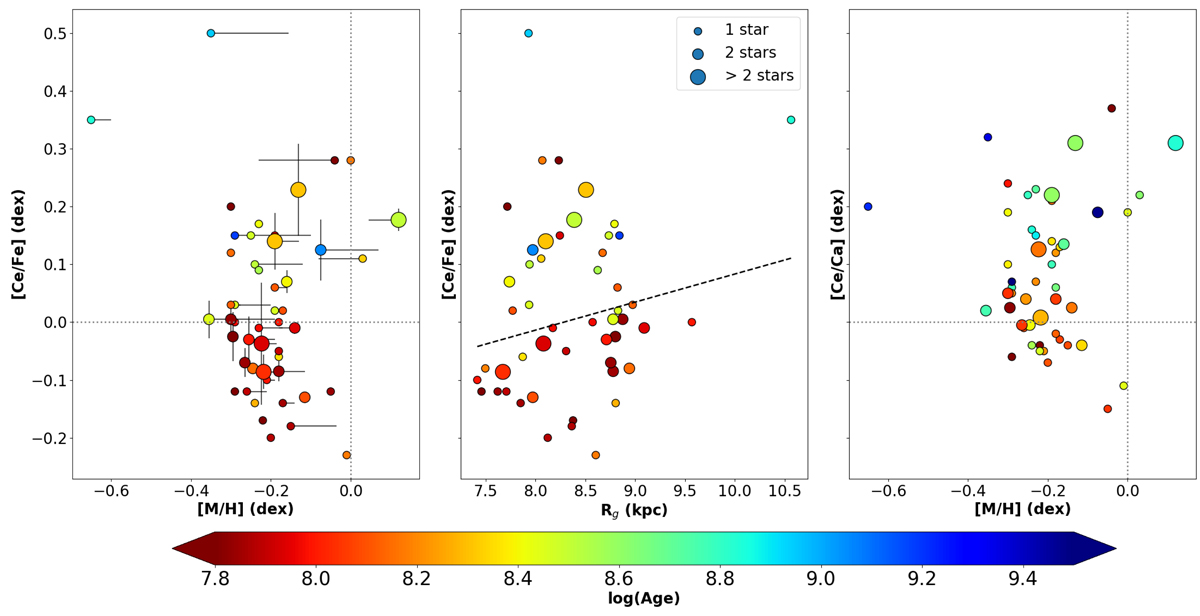
Fig. 11.
Download original image
Left panel: [Ce/Fe] vs. [M/H] colour-coded with the OC ages. Each [Ce/Fe] and [M/H] value is the mean of all the OC members. Vertical error bars are the mean dispersion in cerium abundances (star-to-star scatter), and the horizontal lines link the GSP-Spec [M/H] to the reference values. Central panel: [Ce/Fe] abundances with respect to the guiding radius colour-coded with age. The dashed line illustrates the derived radial gradient. Left panel: [Ce/Ca] ratio with respect to the metallicity colour-coded with the age.
Current usage metrics show cumulative count of Article Views (full-text article views including HTML views, PDF and ePub downloads, according to the available data) and Abstracts Views on Vision4Press platform.
Data correspond to usage on the plateform after 2015. The current usage metrics is available 48-96 hours after online publication and is updated daily on week days.
Initial download of the metrics may take a while.