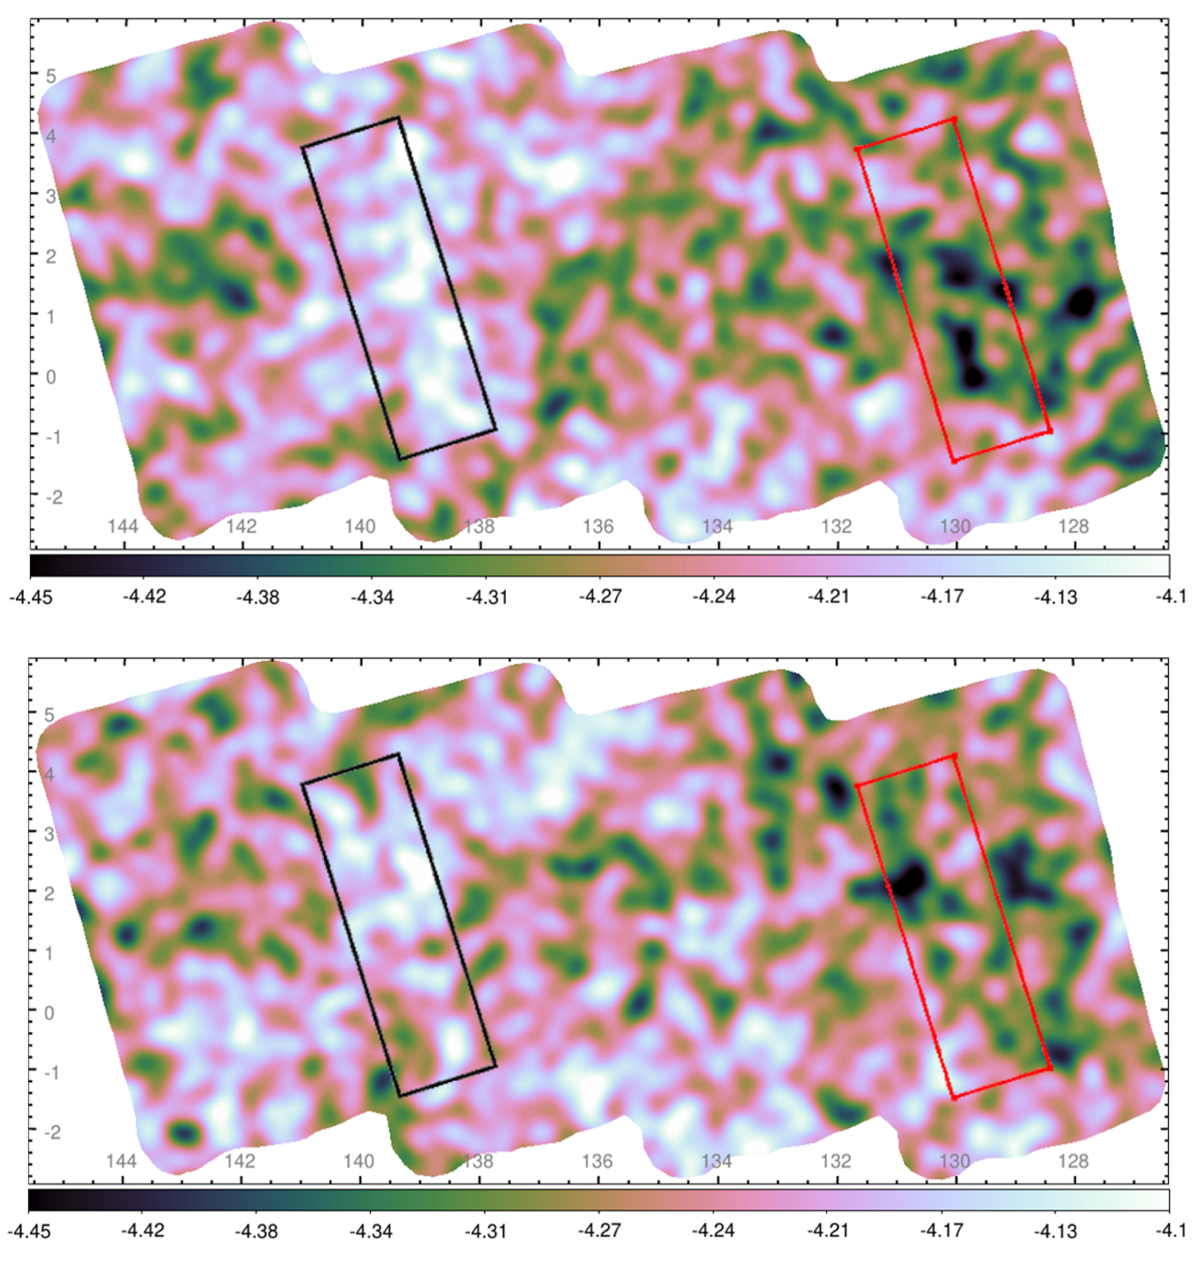
Fig. 3.

Download original image
Total X-ray emission observed by eROSITA in the eFEDS region during for e1 and e2, respectively (from top to bottom). Despite the worse statistics, the same enhancement of the soft X-ray emission is observed at the same location as during e0 (Fig. 2). The black and red rectangle show the extraction regions for the bright and dim spectra, respectively. We note the slightly different color scale compared with Fig. 2. Equatorial coordinates are applied.
Current usage metrics show cumulative count of Article Views (full-text article views including HTML views, PDF and ePub downloads, according to the available data) and Abstracts Views on Vision4Press platform.
Data correspond to usage on the plateform after 2015. The current usage metrics is available 48-96 hours after online publication and is updated daily on week days.
Initial download of the metrics may take a while.


