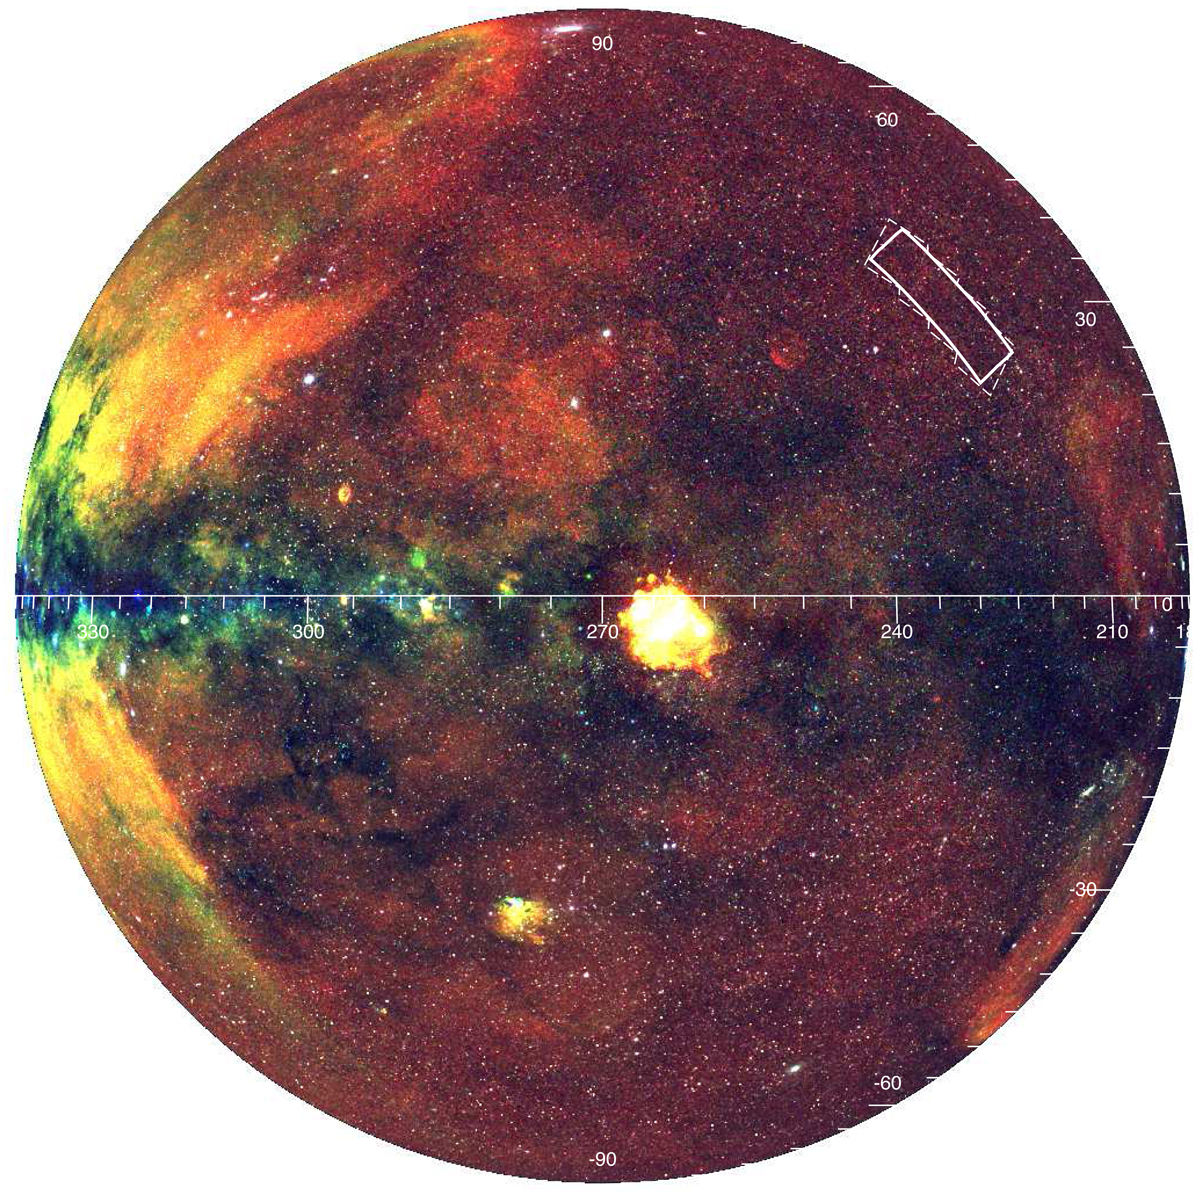
Fig. 12.
Download original image
eROSITA e1 map of the western Galactic hemisphere in orthographic projection. Red, green, and blue show the 0.3–0.6, 0.6–1.0, 1.0–2.3 keV energy bands, respectively. The white regions show the footprint of the eFEDS region the extraction region of the average eFEDS spectrum (see Ponti et al. 2022). Pat thechiness of the soft X-ray diffuse emission in the eFEDS region can be squinted also in this all sky map. Additionally, this map reveals that similar patchiness away from the Galactic plane and Galactic center.
Current usage metrics show cumulative count of Article Views (full-text article views including HTML views, PDF and ePub downloads, according to the available data) and Abstracts Views on Vision4Press platform.
Data correspond to usage on the plateform after 2015. The current usage metrics is available 48-96 hours after online publication and is updated daily on week days.
Initial download of the metrics may take a while.