Fig. 1.
Download original image
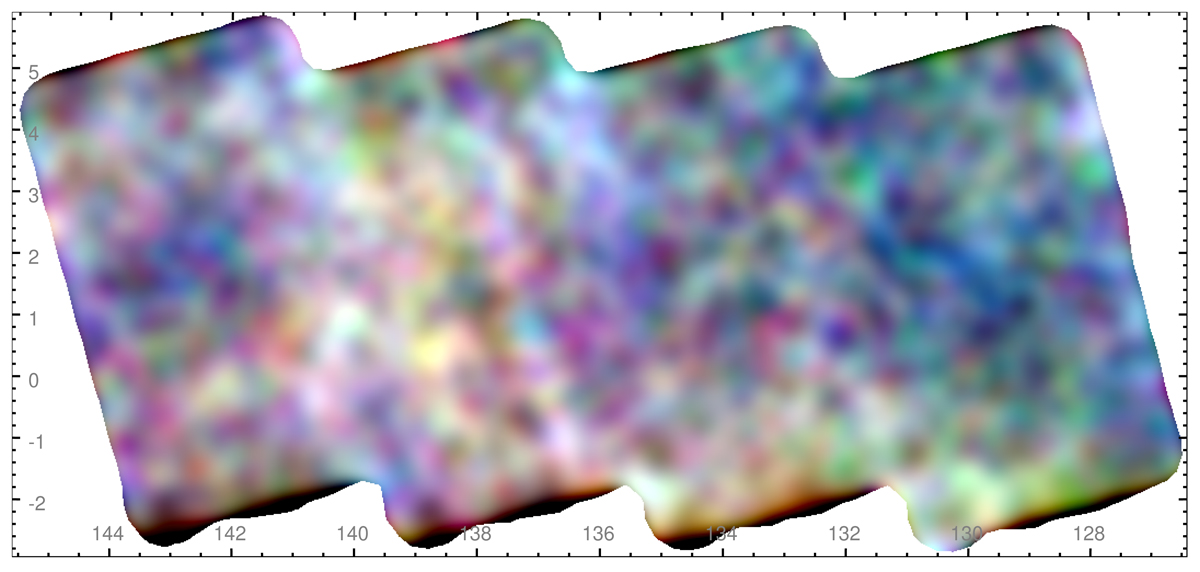
Total X-ray emission observed by eROSITA in the eFEDS region, during e0. The contribution due to point sources has been removed through a wavelet filtering. In red, green, and blue colours we show the 0.3–0.45 keV; 0.45–0.7 keV, and 0.7–2.3 keV bands, respectively. Variations of the surface brightness of the diffuse emission are clearly observed from a sub-degree to several degrees scale. The brightest patch appears slightly redder, which is consistent with the inference that the flux in the soft band is less absorbed. Equatorial coordinates are applied.
Current usage metrics show cumulative count of Article Views (full-text article views including HTML views, PDF and ePub downloads, according to the available data) and Abstracts Views on Vision4Press platform.
Data correspond to usage on the plateform after 2015. The current usage metrics is available 48-96 hours after online publication and is updated daily on week days.
Initial download of the metrics may take a while.