Open Access
Fig. 7
Download original image
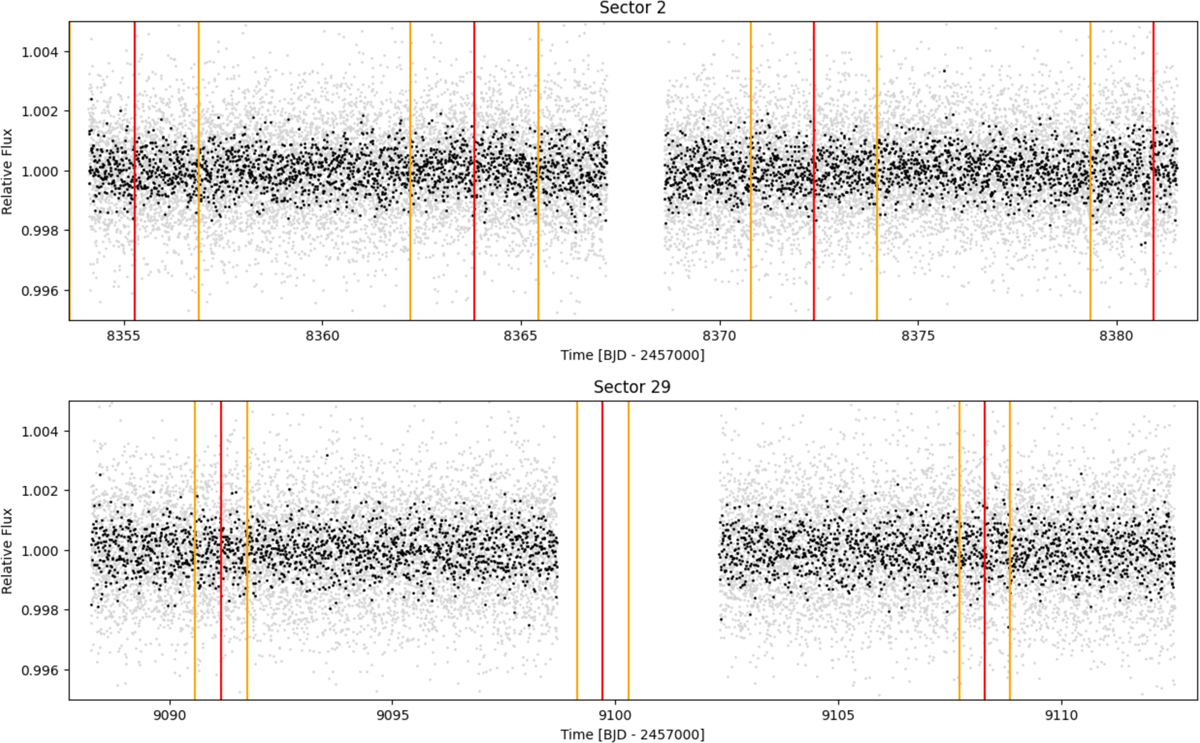
TESS 2-min cadence PDC SAP data of L363-38. The unbinned data are shown as grey points, and the data binned into 30-min intervals are shown in black. The predicted times of transit and their 1-σ probability ranges are indicated with vertical red and orange lines, respectively.
Current usage metrics show cumulative count of Article Views (full-text article views including HTML views, PDF and ePub downloads, according to the available data) and Abstracts Views on Vision4Press platform.
Data correspond to usage on the plateform after 2015. The current usage metrics is available 48-96 hours after online publication and is updated daily on week days.
Initial download of the metrics may take a while.