Fig. 2
Download original image
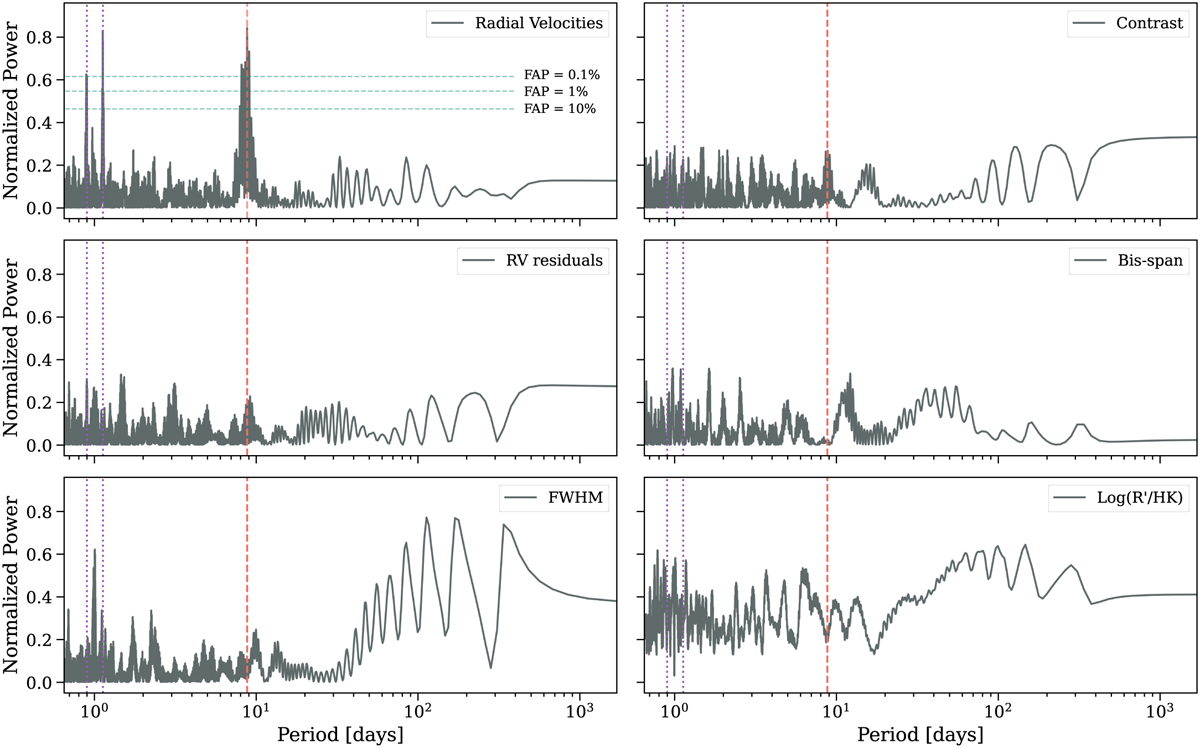
Periodograms of ESPRESSO time series (RV data and stellar activity indicators). The vertical lines mark the position of the companion (P = 8.781 days, red dashed line) and of the aliases (violet dotted lines). A fainter peak at P = 8.781 days is also observed in the contrast indicator (although not significant), but the periodogram of the RV does not show a significant change after applying a linear detrending with any of the indicators. The 0.1%, 1%, and 10% false alarm probability (FAP) levels for the RV periodogram are shown as dashed green horizontal lines.
Current usage metrics show cumulative count of Article Views (full-text article views including HTML views, PDF and ePub downloads, according to the available data) and Abstracts Views on Vision4Press platform.
Data correspond to usage on the plateform after 2015. The current usage metrics is available 48-96 hours after online publication and is updated daily on week days.
Initial download of the metrics may take a while.