Fig. 1
Download original image
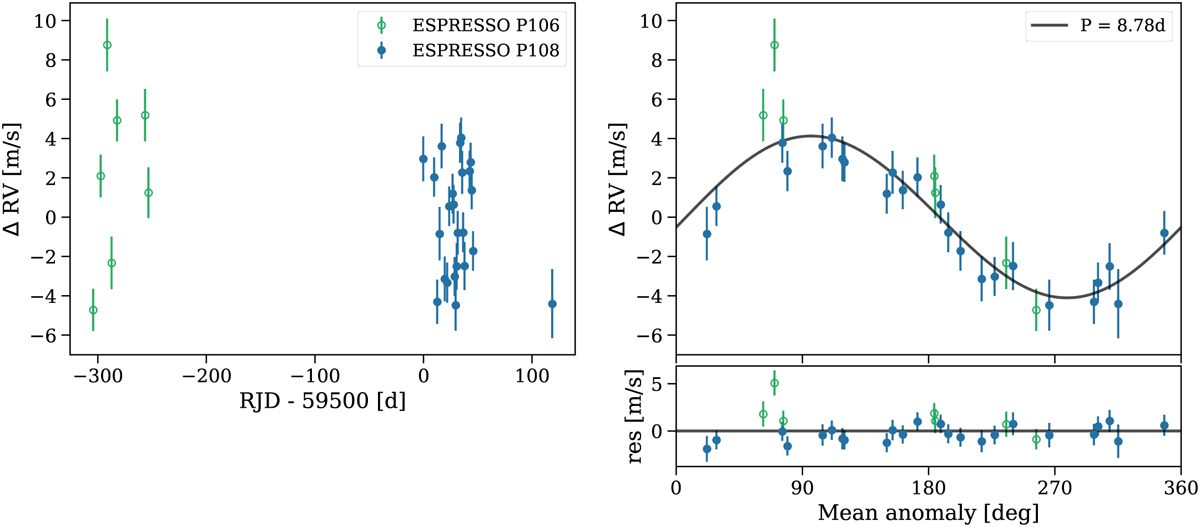
ESPRESSO radial velocity data of L 363-38 used in this analysis. Left: ESPRESSO radial velocities of L 363-38 after subtracting the linear offset and adding the instrumental jitter to the error bars. The measurements obtained during P106 and P108 are shown as open green and filled blue symbols, respectively. Right: phase-folded radial velocity curve of the 8.781d signal. The measurements corresponding to P106 and P108 are defined as in the left panel, while the grey curve shows the best-fit Keplerian model. The bottom panel shows the residuals from the best-fit model.
Current usage metrics show cumulative count of Article Views (full-text article views including HTML views, PDF and ePub downloads, according to the available data) and Abstracts Views on Vision4Press platform.
Data correspond to usage on the plateform after 2015. The current usage metrics is available 48-96 hours after online publication and is updated daily on week days.
Initial download of the metrics may take a while.