Fig. 7
Download original image
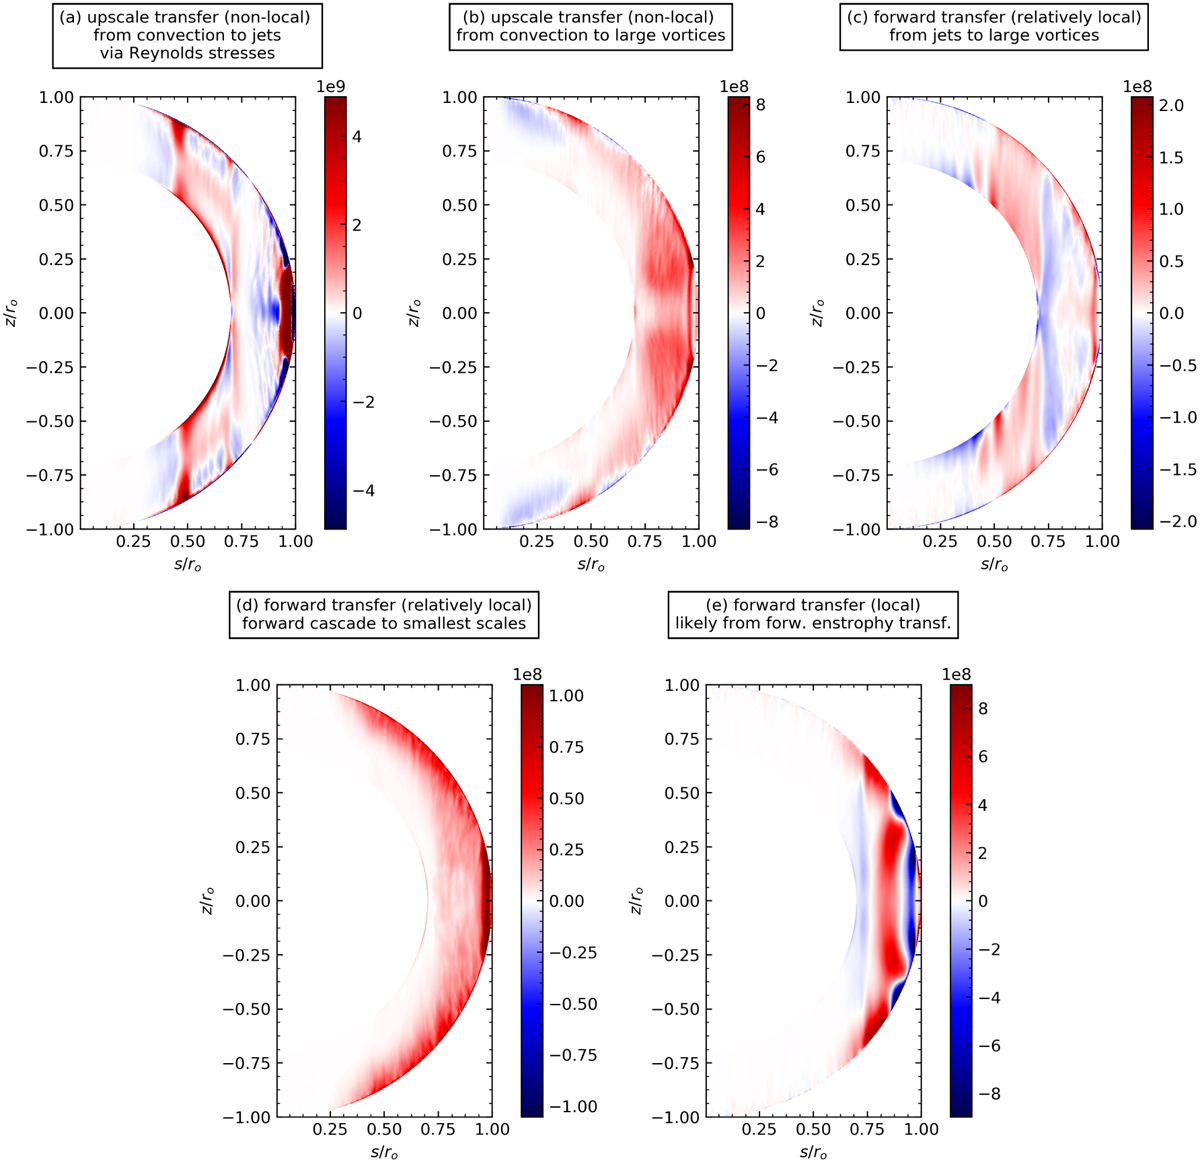
Spatial contribution, Ti(r, θ), to the energy transfer function, T(m, m′), summed over different values of m and m’ according to the masks (i) = (a),(b),(c),(d),(e) shown in Fig. 6. The panels display results for the direct driving of the jets by the convective scales via upscale energy transfers and Reynolds stresses (a), the upscale transfer to large eddies (b), the feeding of large-scale vortices from the jet energy (c), the small-scale forward cascade (d), and the local forward transfer likely associated with a forward enstrophy transfer (e). All panels are saturated at three times their maximum value, except for panel (a), which is saturated at 18 times its maximum value.
Current usage metrics show cumulative count of Article Views (full-text article views including HTML views, PDF and ePub downloads, according to the available data) and Abstracts Views on Vision4Press platform.
Data correspond to usage on the plateform after 2015. The current usage metrics is available 48-96 hours after online publication and is updated daily on week days.
Initial download of the metrics may take a while.