Fig. 6
Download original image
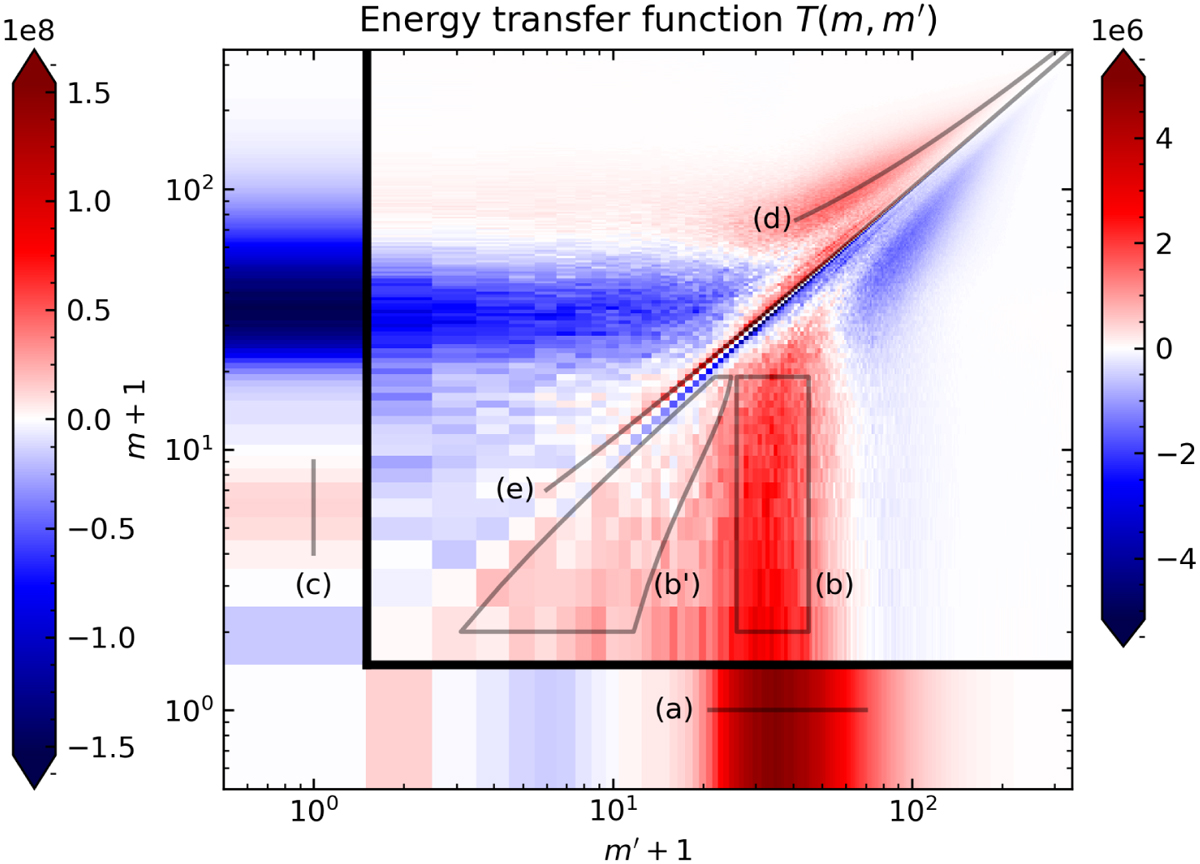
Scale-to-scale transfer of kinetic energy, T (m, m′), in the statistically steady state. Note that the figure has logarithmic axes and two colorbars; the left one indicates values for m = 0 or m′ = 0 and the right one for m, m′ > 0. A positive value of T(m, m′) shows that kinetic energy is transferred from wave number m′ to wave number m. We use the regions indicated by gray lines and labeled with letters (a) to (e) to refer to specific regions of the plot in the text and show the different spatial contributions to T(m, m′) for those regions in Fig. 7.
Current usage metrics show cumulative count of Article Views (full-text article views including HTML views, PDF and ePub downloads, according to the available data) and Abstracts Views on Vision4Press platform.
Data correspond to usage on the plateform after 2015. The current usage metrics is available 48-96 hours after online publication and is updated daily on week days.
Initial download of the metrics may take a while.