Fig. 2
Download original image
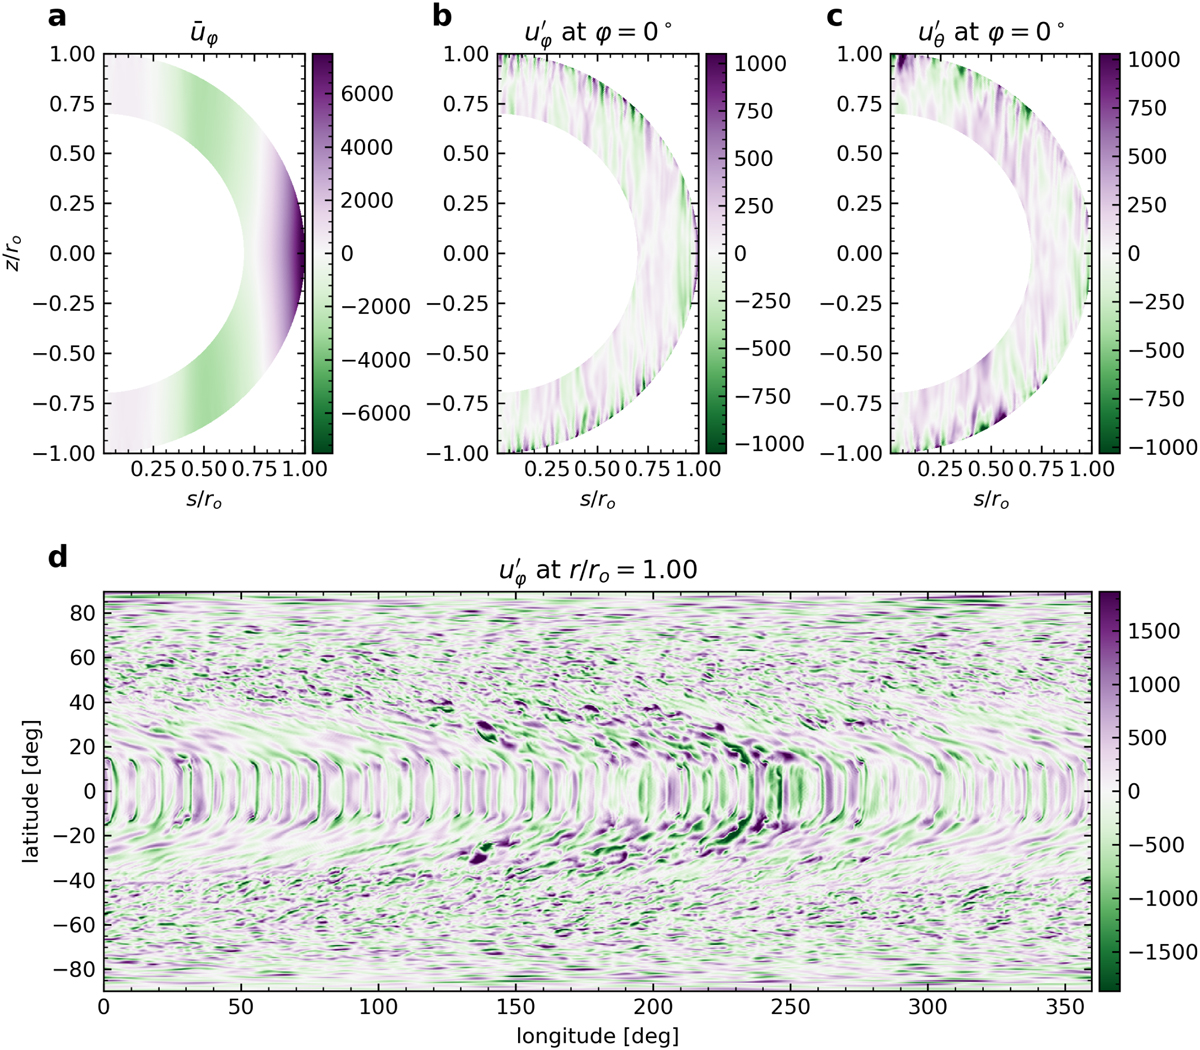
Typical simulation snapshots in the statistically steady state. Panel (a) shows the jet profile, ![]() . Panels (b) and (c) show the fluctuations around the zonal mean of the zonal and meridional winds,
. Panels (b) and (c) show the fluctuations around the zonal mean of the zonal and meridional winds, ![]() and
and ![]() , at the central meridian. Panel (d) shows
, at the central meridian. Panel (d) shows ![]() at the top boundary. Panels (b)–(d) are saturated at half of the maximum value in the domain shown.
at the top boundary. Panels (b)–(d) are saturated at half of the maximum value in the domain shown.
Current usage metrics show cumulative count of Article Views (full-text article views including HTML views, PDF and ePub downloads, according to the available data) and Abstracts Views on Vision4Press platform.
Data correspond to usage on the plateform after 2015. The current usage metrics is available 48-96 hours after online publication and is updated daily on week days.
Initial download of the metrics may take a while.