Open Access
Fig. 14
Download original image
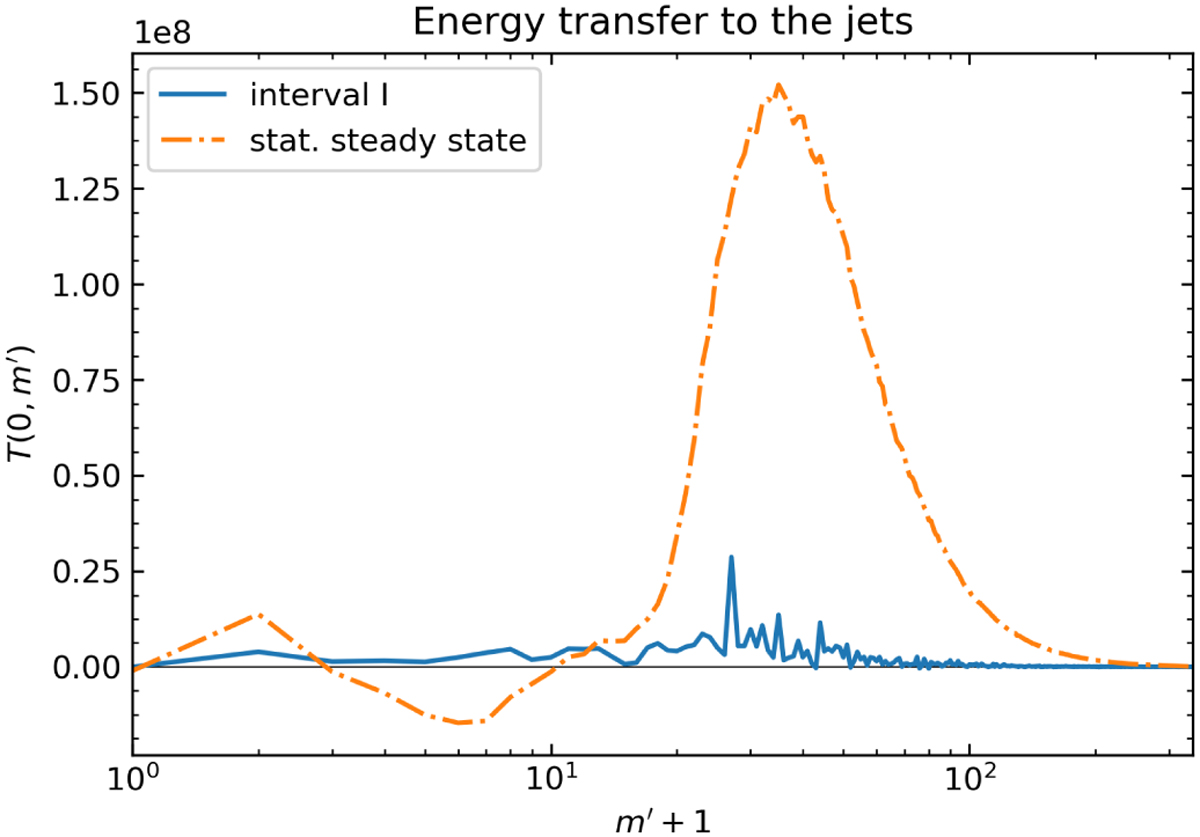
Kinetic energy transfer to the jets, T(0, m′), for the spin-up run. The transfer functions were computed for the first interval directly after the start of the spin-up (interval I). The time window is shown as light gray band in Fig. 12. For comparison, we also show results for the statistically steady state from Fig. 6.
Current usage metrics show cumulative count of Article Views (full-text article views including HTML views, PDF and ePub downloads, according to the available data) and Abstracts Views on Vision4Press platform.
Data correspond to usage on the plateform after 2015. The current usage metrics is available 48-96 hours after online publication and is updated daily on week days.
Initial download of the metrics may take a while.