Open Access
Fig. 5.
Download original image
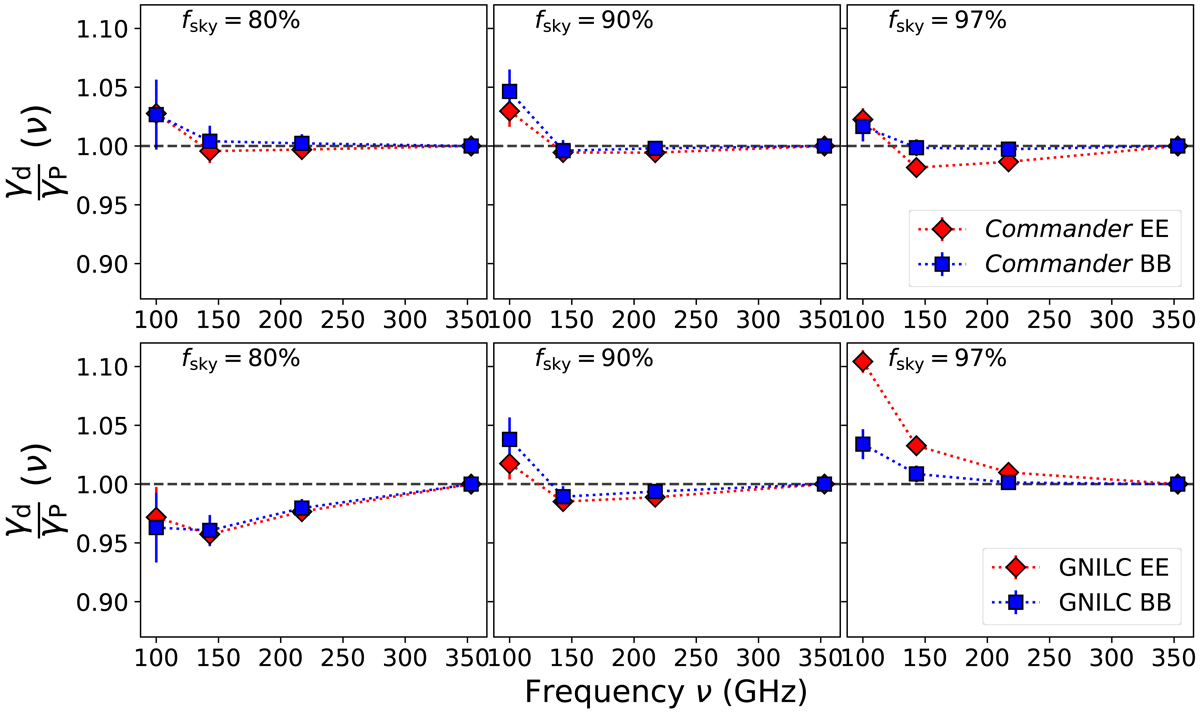
Dust mean SED γd(ν) computed for the reference models: Commander (top row) and GNILC (bottom row). EE and BB values are shown in red and blue, respectively. From left to right: Results for fsky = [80, 90, 97]%. All values are normalized by the γP(ν) values obtained from the data and shown in Fig. 4.
Current usage metrics show cumulative count of Article Views (full-text article views including HTML views, PDF and ePub downloads, according to the available data) and Abstracts Views on Vision4Press platform.
Data correspond to usage on the plateform after 2015. The current usage metrics is available 48-96 hours after online publication and is updated daily on week days.
Initial download of the metrics may take a while.