Fig. 3.
Download original image
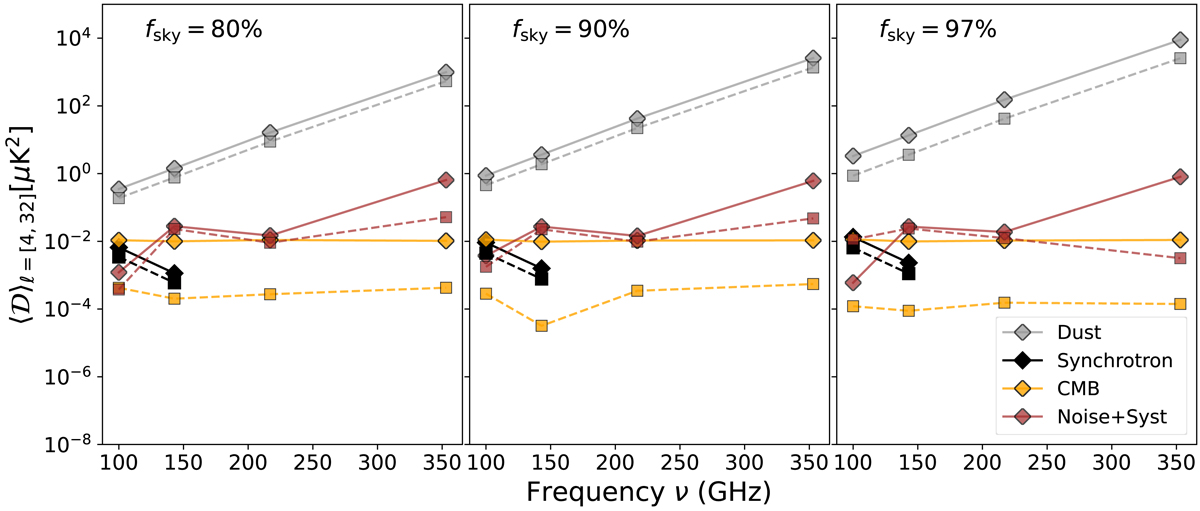
Amplitudes, averaged for 4 < ℓ < 32, of the 𝒟ℓEE (diamond) and BB (square) power spectra versus frequency. Each plot presents the spectra of the Commander dust model (gray), our synchrotron estimate at 100 and 143 GHz (black), the CMB (orange), and the SRoll2 noise plus systematics (light brown). The three plots from left to right correspond to fsky = 80, 90, and 97%.
Current usage metrics show cumulative count of Article Views (full-text article views including HTML views, PDF and ePub downloads, according to the available data) and Abstracts Views on Vision4Press platform.
Data correspond to usage on the plateform after 2015. The current usage metrics is available 48-96 hours after online publication and is updated daily on week days.
Initial download of the metrics may take a while.