Fig. 13.
Download original image
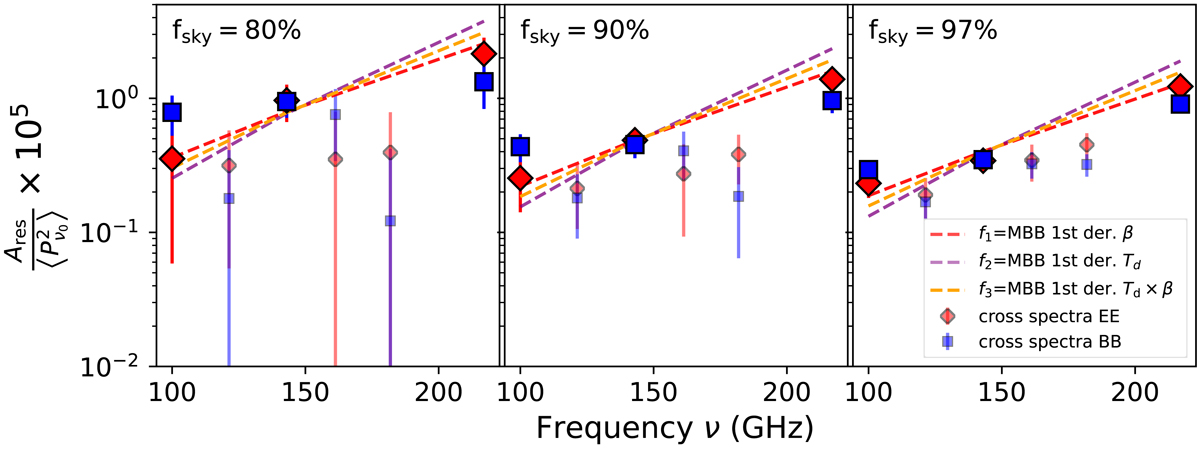
Residual amplitudes Ares(ν), (dark markers) EE (red) and BB (blue) for fsky = [80, 90, 97]%, are shown from left to right. A fit to the data EE accounting for the three components of the moment expansion modeling separately, is described in Eq. (20) and is shown as a dashed line. A cross-power spectra correlation between pair of frequencies: 100 × 143, 100 × 217 and 143 × 217 is shown in smaller and lightened markers.
Current usage metrics show cumulative count of Article Views (full-text article views including HTML views, PDF and ePub downloads, according to the available data) and Abstracts Views on Vision4Press platform.
Data correspond to usage on the plateform after 2015. The current usage metrics is available 48-96 hours after online publication and is updated daily on week days.
Initial download of the metrics may take a while.