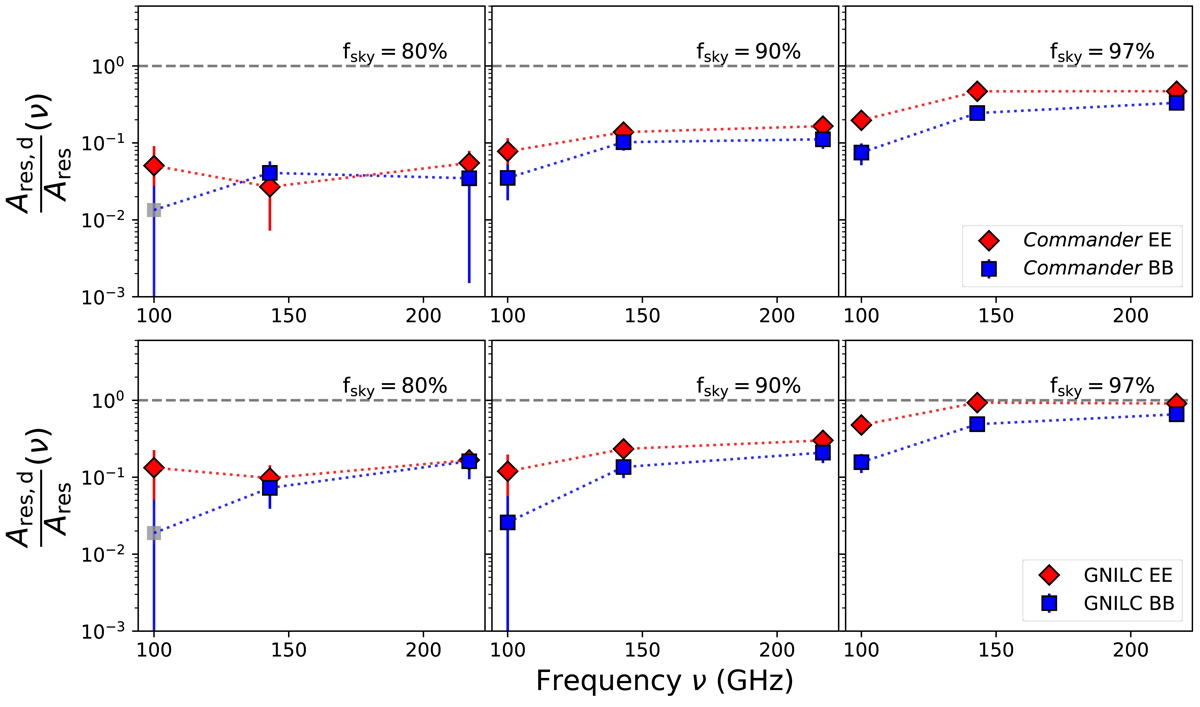
Fig. 11.
Download original image
Residual amplitudes Ares, d(ν) obtained for the reference models Commander (top) and GNILC (bottom). Red and blue colors represent the EE and BB results, respectively. These values are estimated by averaging between ℓ-range 4–32 and normalizing to the amplitudes of the residuals obtained from the Planck data Ares(ν). See Eq. (12) for details. Results for fsky = [80, 90, 97]% are shown from left to right. The absolute value of BB negative results found at 100 GHz for fsky = 80% is shown in gray.
Current usage metrics show cumulative count of Article Views (full-text article views including HTML views, PDF and ePub downloads, according to the available data) and Abstracts Views on Vision4Press platform.
Data correspond to usage on the plateform after 2015. The current usage metrics is available 48-96 hours after online publication and is updated daily on week days.
Initial download of the metrics may take a while.