Open Access
Fig. 7.
Download original image
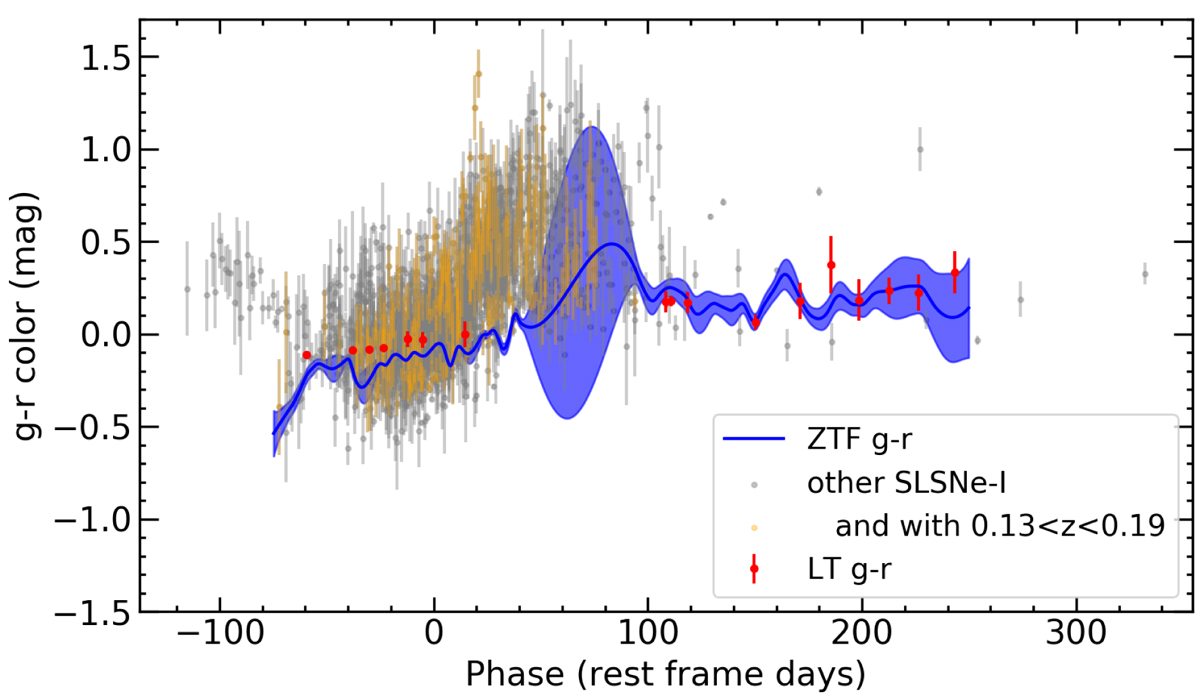
SN 2020qlb g − r color evolution created from the ZTF-g and -r filter GP interpolations in Sect. 3.2 in blue and the g − r measurements with the LT in red. The gray background is a scatter plot of the 75 SLSNe-I and orange is for the 9 with 0.13 < z < 0.19 from Chen et al. (2022b, Fig. 13).
Current usage metrics show cumulative count of Article Views (full-text article views including HTML views, PDF and ePub downloads, according to the available data) and Abstracts Views on Vision4Press platform.
Data correspond to usage on the plateform after 2015. The current usage metrics is available 48-96 hours after online publication and is updated daily on week days.
Initial download of the metrics may take a while.