Fig. 3.
Download original image
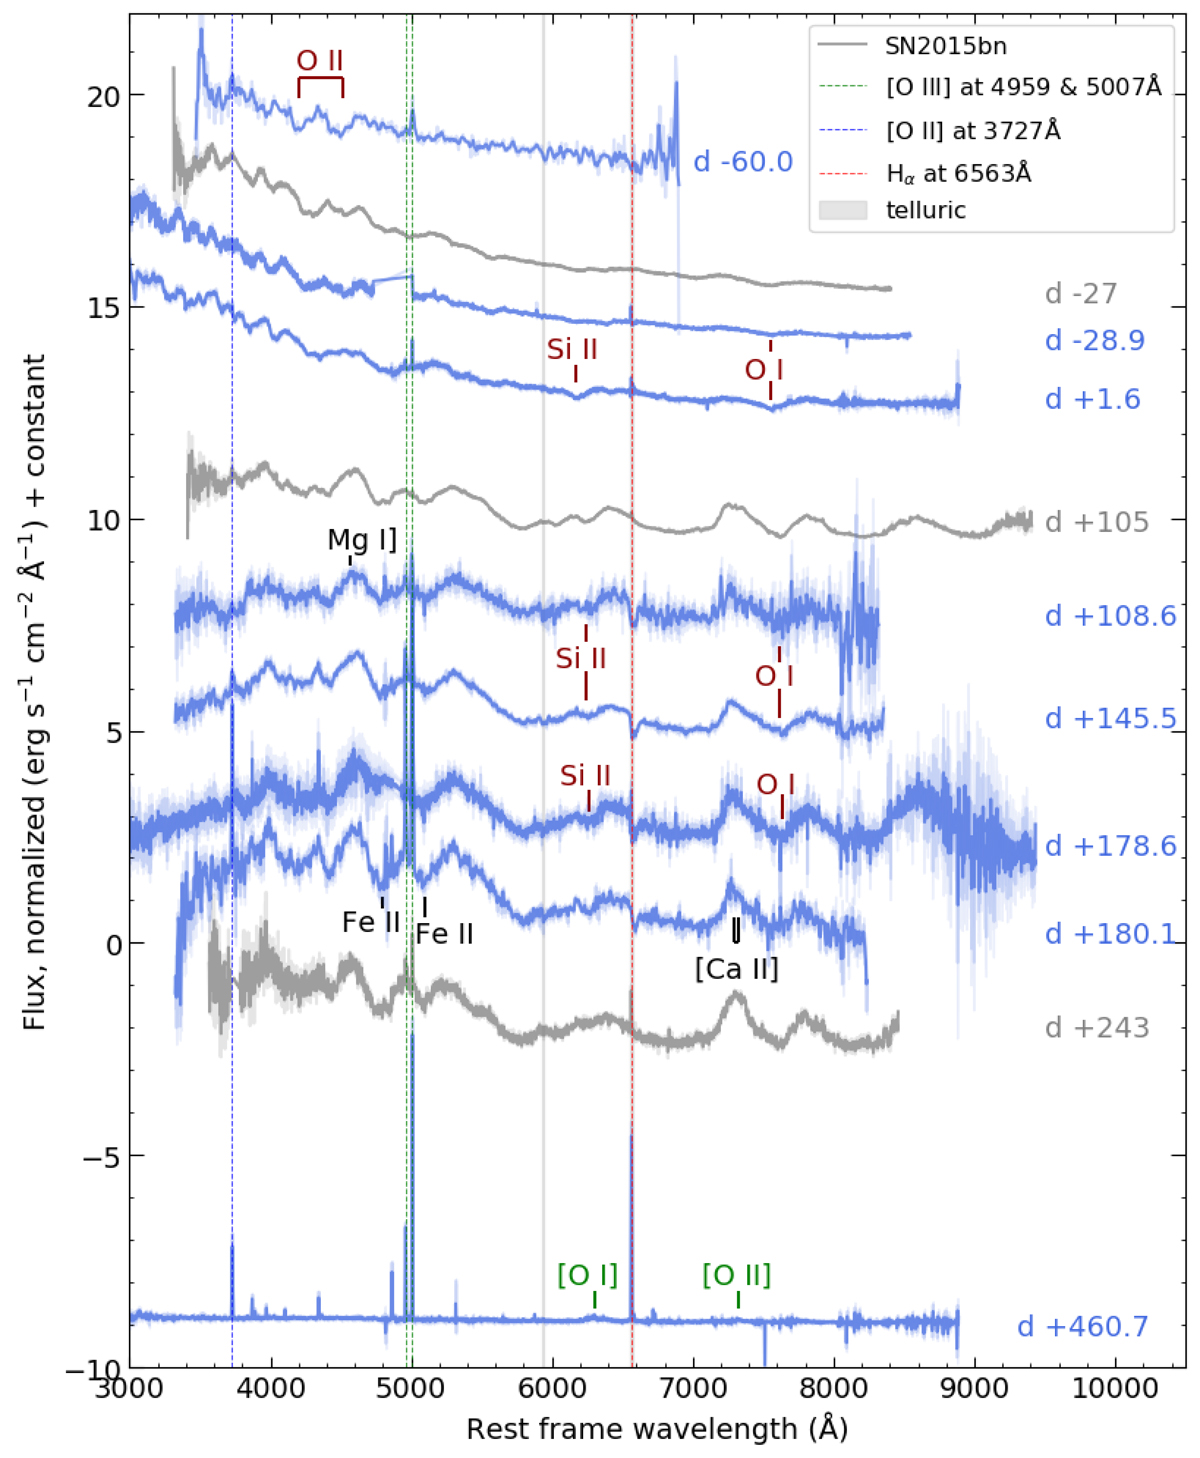
Spectral sequence of SN 2020qlb. The dark blue SN 2020qlb spectra were smoothed using a Savitzky-Golay low pass filter. A lighter shade of blue is used for un-smoothed data and measurement errors. Spectra from a well studied SLSN-I (SN 2015bn) are shown in gray for comparison. P-Cygni profile minima used for velocity estimations are marked in dark red. Narrow host galaxy emission lines ([O III], Hα and [O II]) used for redshift estimation are indicated with green, red and blue vertical dashed lines. Blended Fe II absorption features, as well as [Mg I] and [Ca II] emission features are noted in black. Nebular phase [O I] and [O II] broad emission lines are noted in green.
Current usage metrics show cumulative count of Article Views (full-text article views including HTML views, PDF and ePub downloads, according to the available data) and Abstracts Views on Vision4Press platform.
Data correspond to usage on the plateform after 2015. The current usage metrics is available 48-96 hours after online publication and is updated daily on week days.
Initial download of the metrics may take a while.