Open Access
Fig. 18.
Download original image
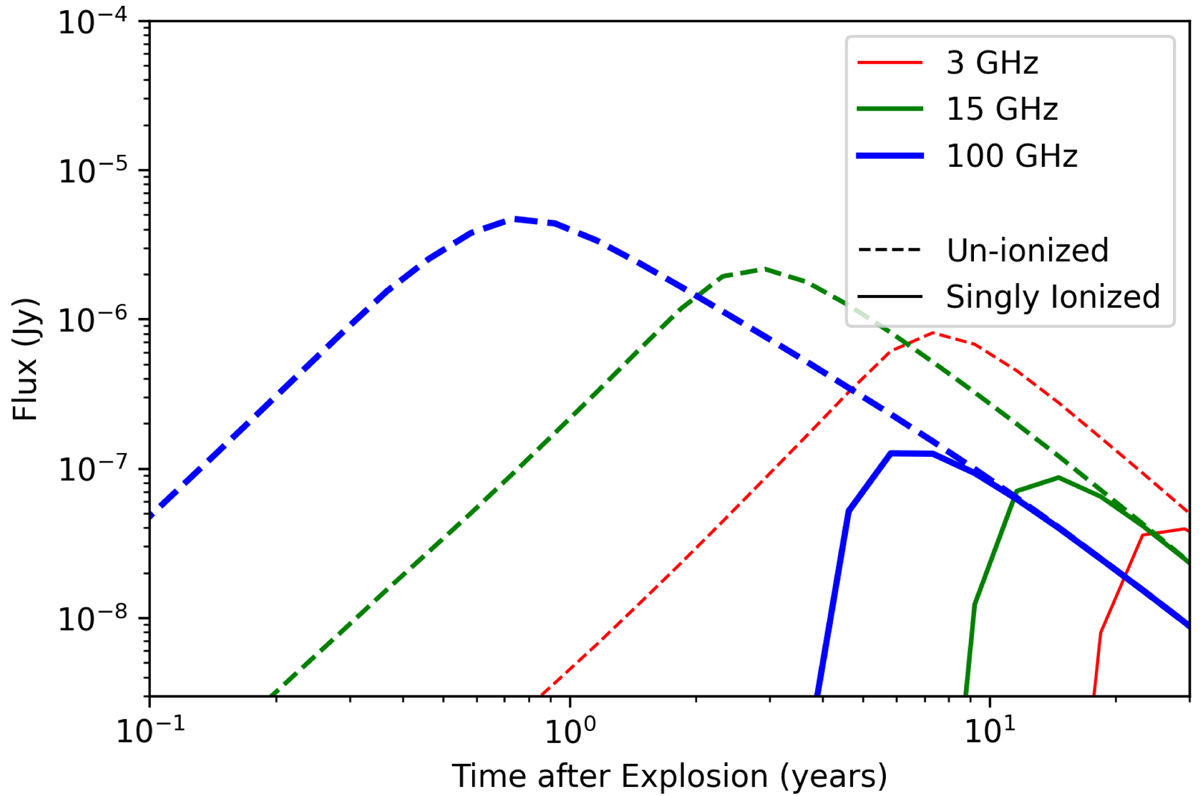
Predicted radio emission for SN 2020qlb at 3 (red), 15 (green), and 100 (blue) GHz. The dashed and solid lines represent estimates of free-free absorption using an un-ionized and singly ionized oxygen ejecta, respectively.
Current usage metrics show cumulative count of Article Views (full-text article views including HTML views, PDF and ePub downloads, according to the available data) and Abstracts Views on Vision4Press platform.
Data correspond to usage on the plateform after 2015. The current usage metrics is available 48-96 hours after online publication and is updated daily on week days.
Initial download of the metrics may take a while.