Open Access
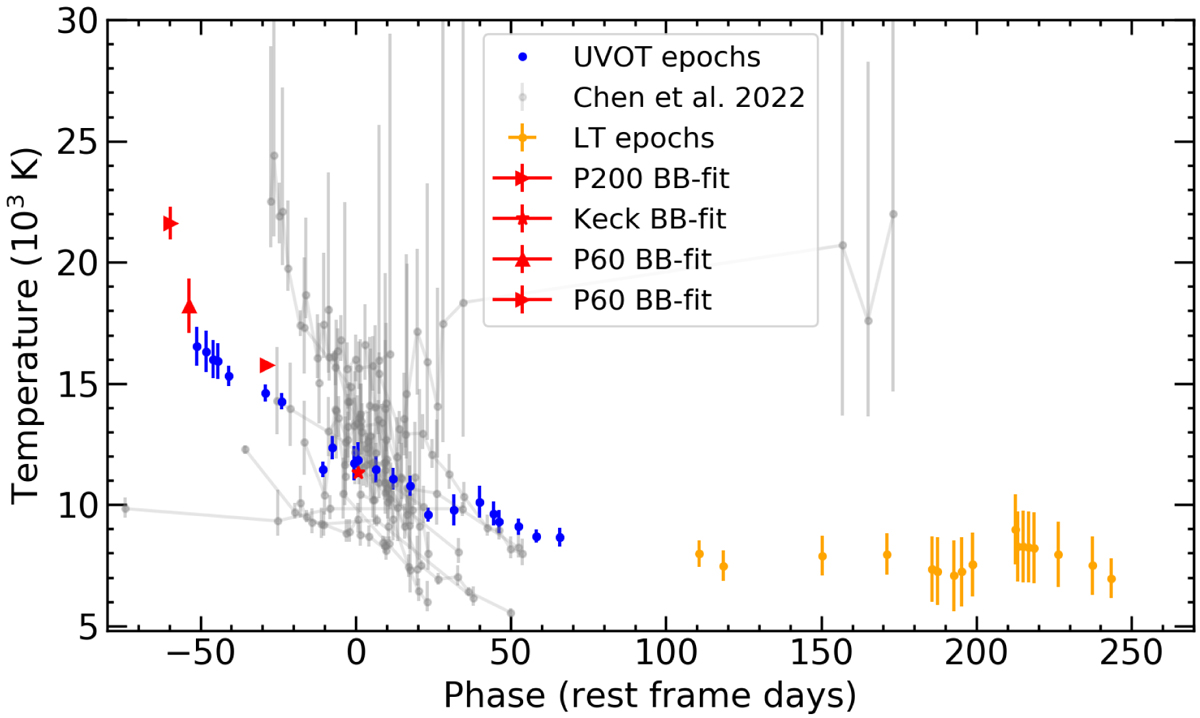
Fig. 11.
Download original image
Temperature evolution of the SN 2020qlb photosphere (blue: fit to UVOT + optical data; orange: fit to LT ugriz data; red: fit to spectra) in comparison to the 31 SLSN-I temperature evolutions from Chen et al. (2022b) shown in light gray.
Current usage metrics show cumulative count of Article Views (full-text article views including HTML views, PDF and ePub downloads, according to the available data) and Abstracts Views on Vision4Press platform.
Data correspond to usage on the plateform after 2015. The current usage metrics is available 48-96 hours after online publication and is updated daily on week days.
Initial download of the metrics may take a while.