Fig. 9.
Download original image
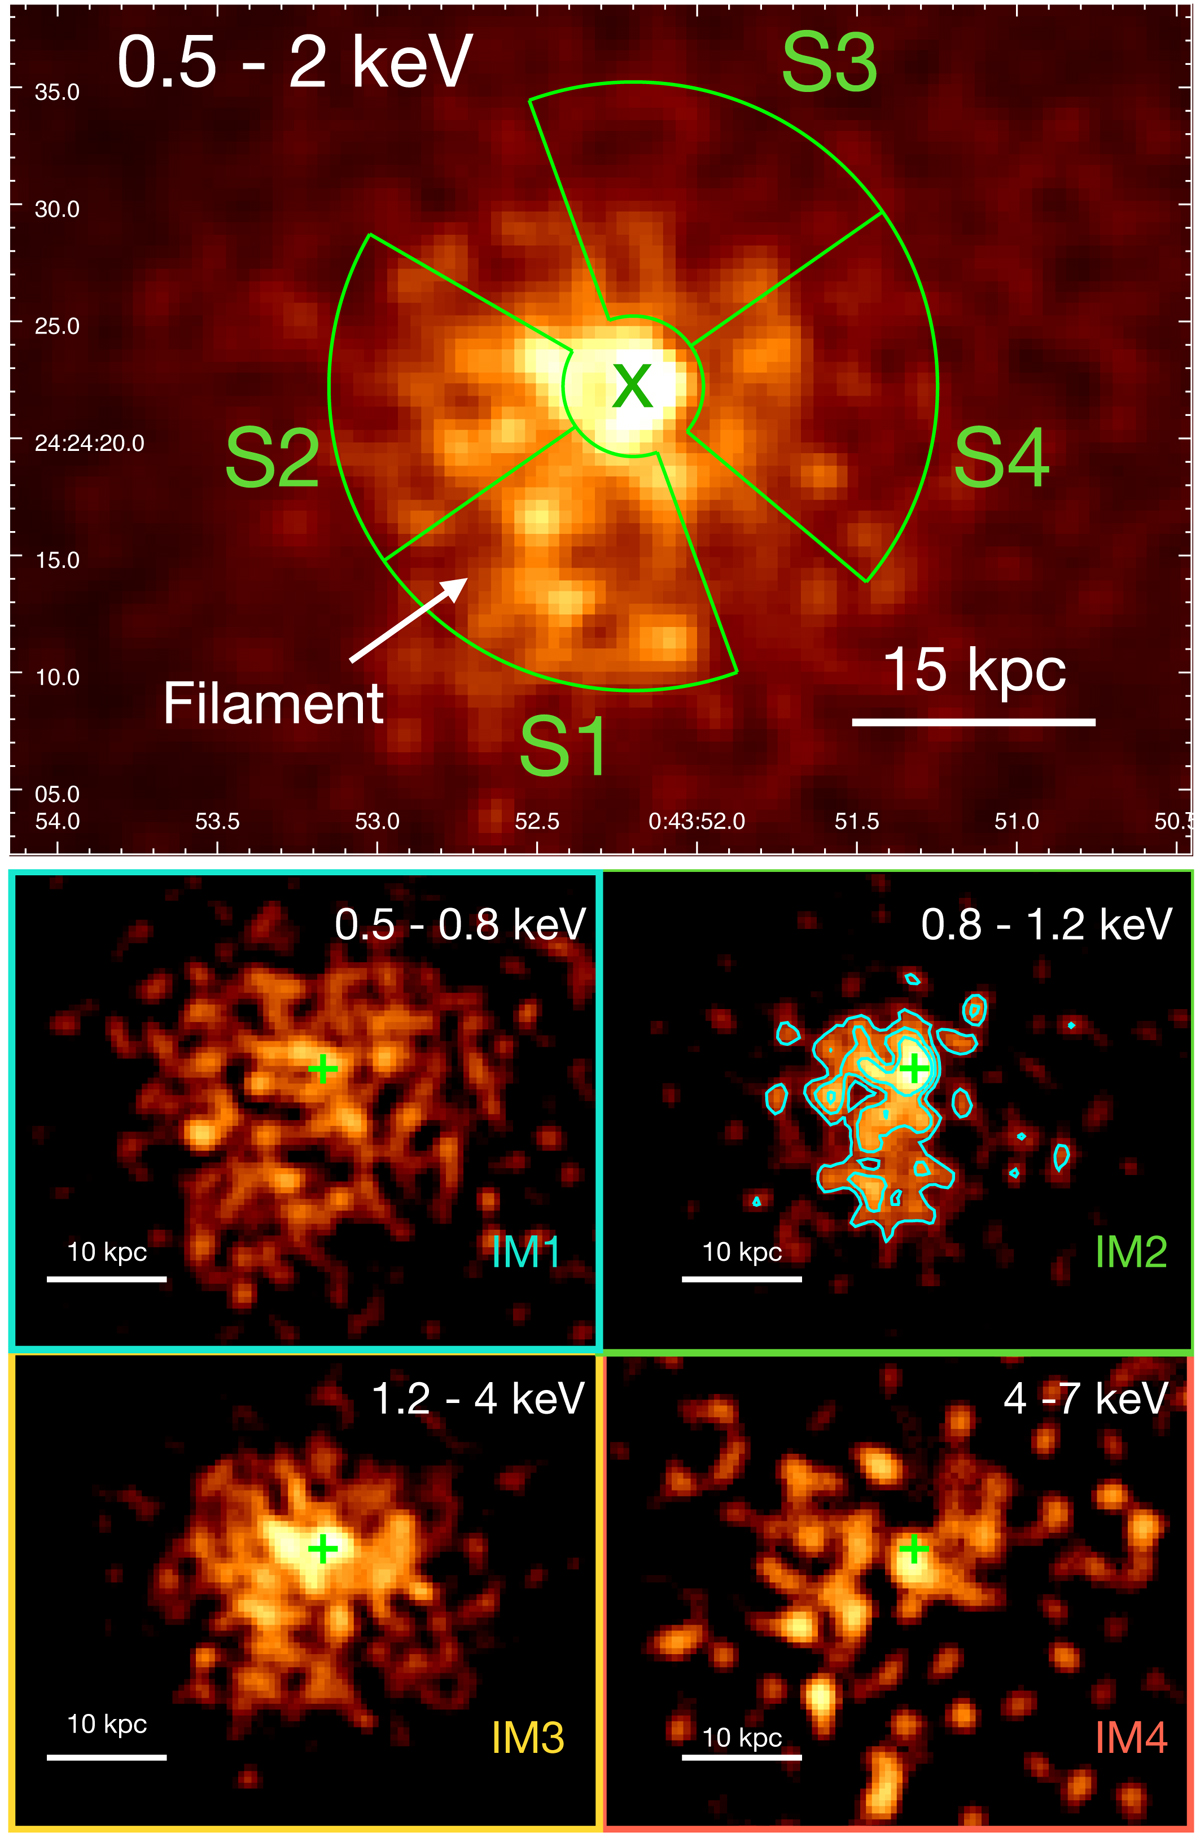
Different Chandra images of the core of the cluster. Upper panel: Chandra image (0.5−2 keV band) of ZwCl 235, smoothed with a Gaussian of kernel size 1.5″, with the four sectors used to study the properties of the filament, that is encompassed by sector S1, overlaid in green (see Sect. 4.7). The green cross marks the center of the BCG. Lower panels: background subtracted, exposure corrected Chandra images of the cluster core in different energy bands, used to show that the ∼1 keV thermal plasma is found predominantly along the filament. The images are smoothed with a Gaussian of kernel size 1.5″ and have matching color scales. The cyan contours in IM2 are spaced by a factor of ![]() , with the highest being 7 × 10⁻⁸ cts s−1 cm−2.
, with the highest being 7 × 10⁻⁸ cts s−1 cm−2.
Current usage metrics show cumulative count of Article Views (full-text article views including HTML views, PDF and ePub downloads, according to the available data) and Abstracts Views on Vision4Press platform.
Data correspond to usage on the plateform after 2015. The current usage metrics is available 48-96 hours after online publication and is updated daily on week days.
Initial download of the metrics may take a while.