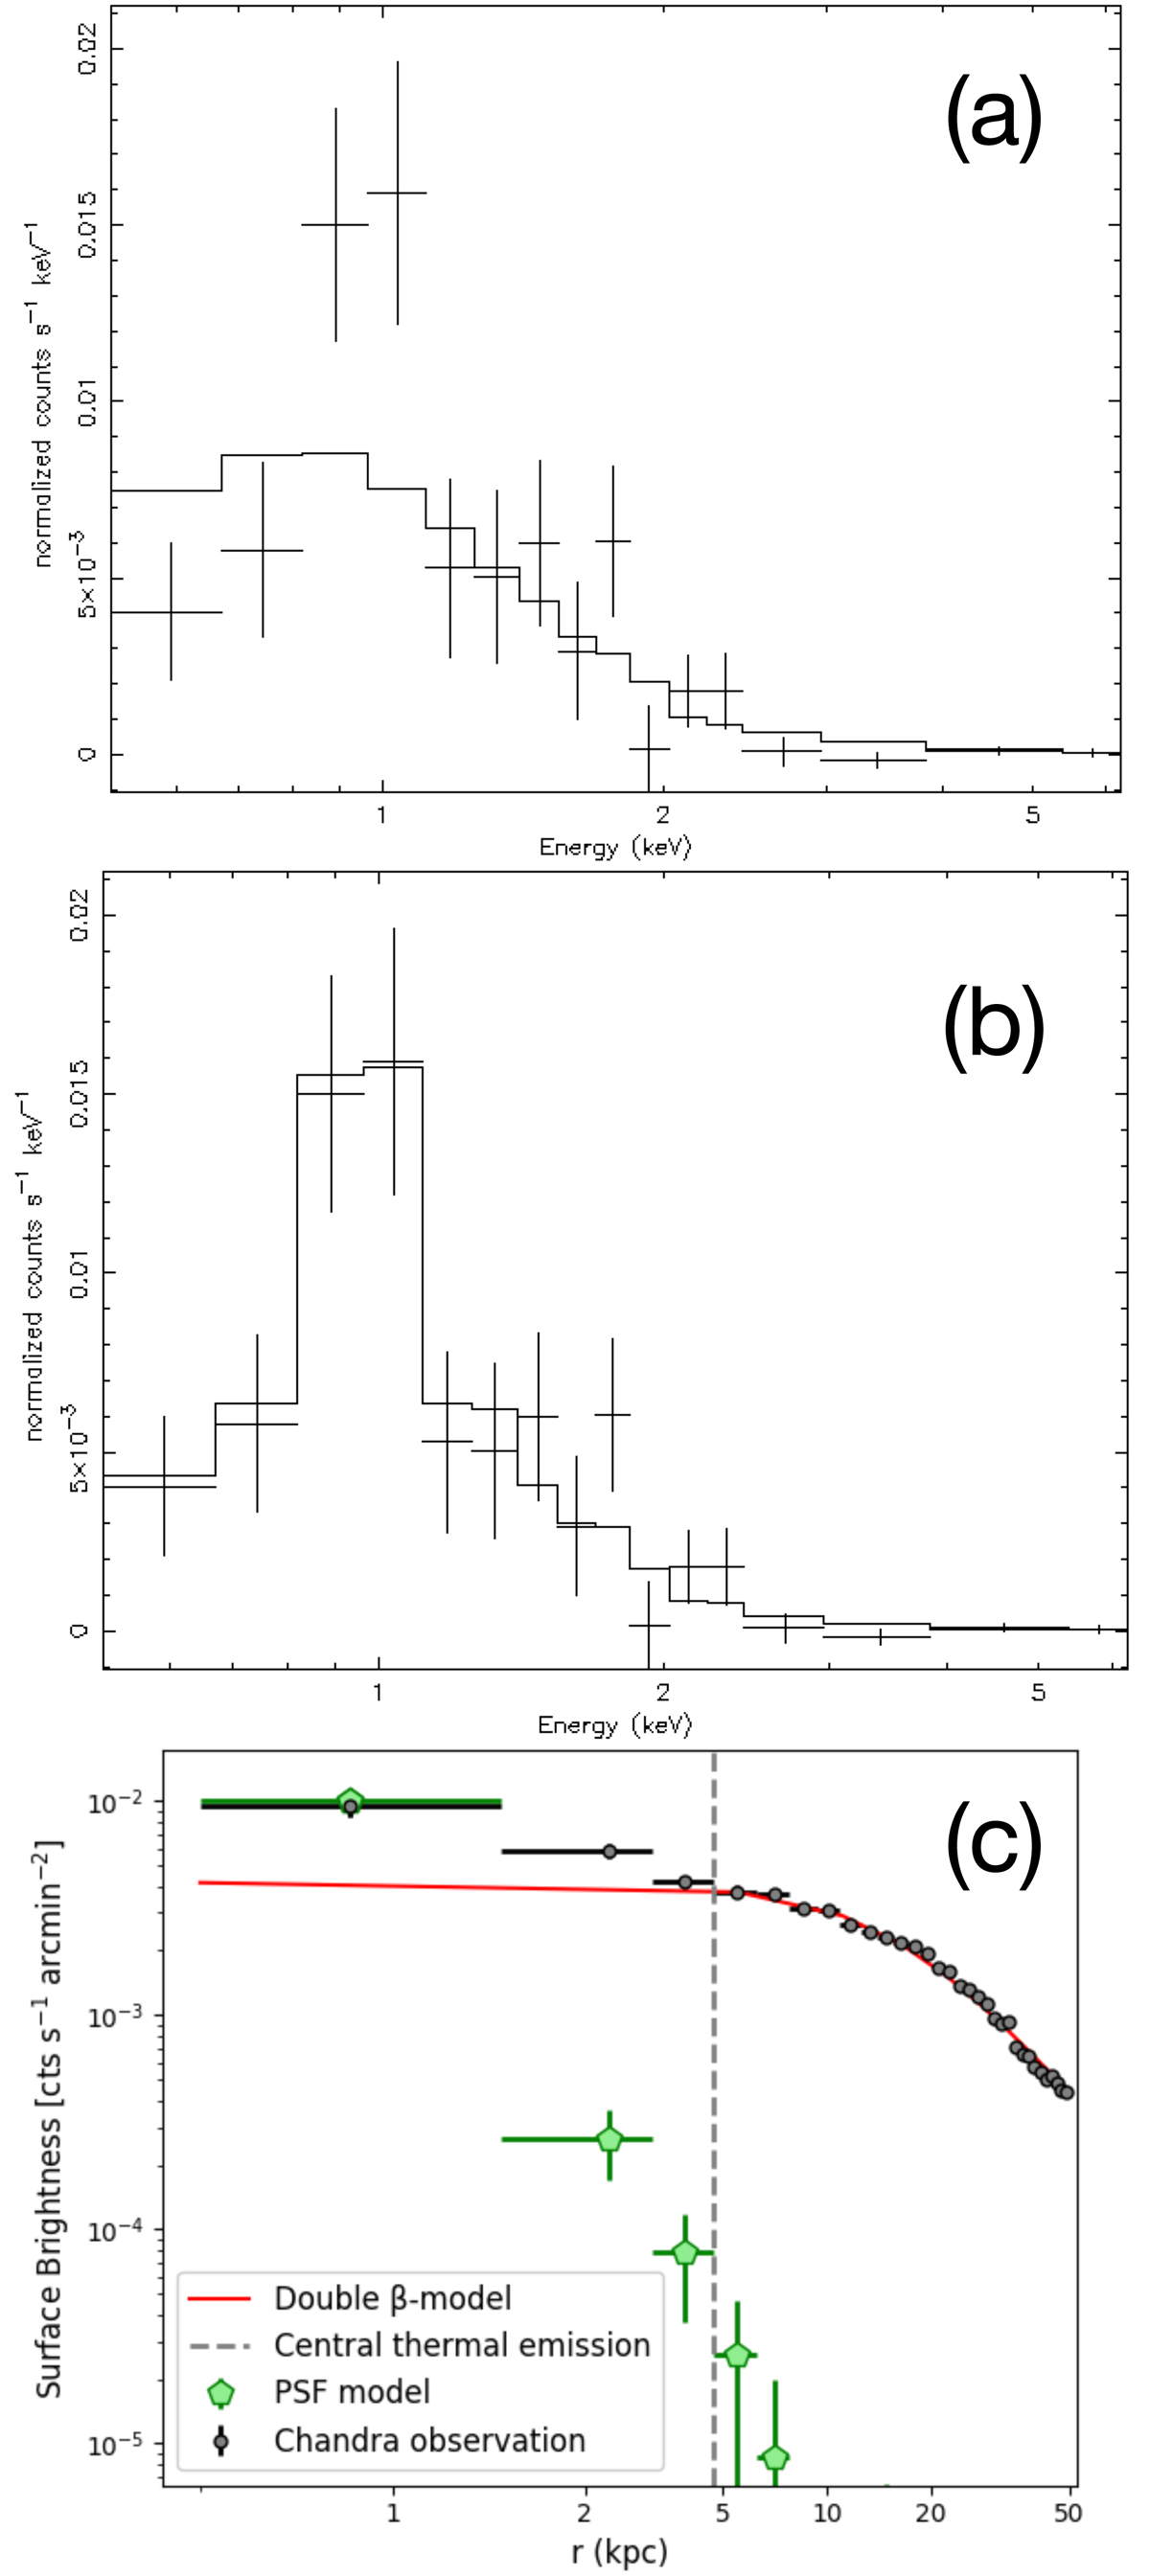
Fig. 8.
Download original image
Analysis of the X-ray emission from the inner 3″. Panel a: 0.5−7 keV Chandra spectrum of the BCG (black crosses), with the absorbed power-law model (first row of Table 5) over-plotted as a black line. Panel b: same as in panel a, with the absorbed thermal model (second row of Table 5) over-plotted as a black line. In both panels, the data are binned to 10 cts bin−1 for plotting purposes. Panel c: comparison between the 0.5−2 keV surface brightness profile of the PSF (green points) and that of the Chandra observation of ZwCl 235 in the inner 50 kpc. The gray dashed line marks the size of the extraction region of the BCG spectrum (3″ ∼ 4.7 kpc; see Sect. 4.6).
Current usage metrics show cumulative count of Article Views (full-text article views including HTML views, PDF and ePub downloads, according to the available data) and Abstracts Views on Vision4Press platform.
Data correspond to usage on the plateform after 2015. The current usage metrics is available 48-96 hours after online publication and is updated daily on week days.
Initial download of the metrics may take a while.