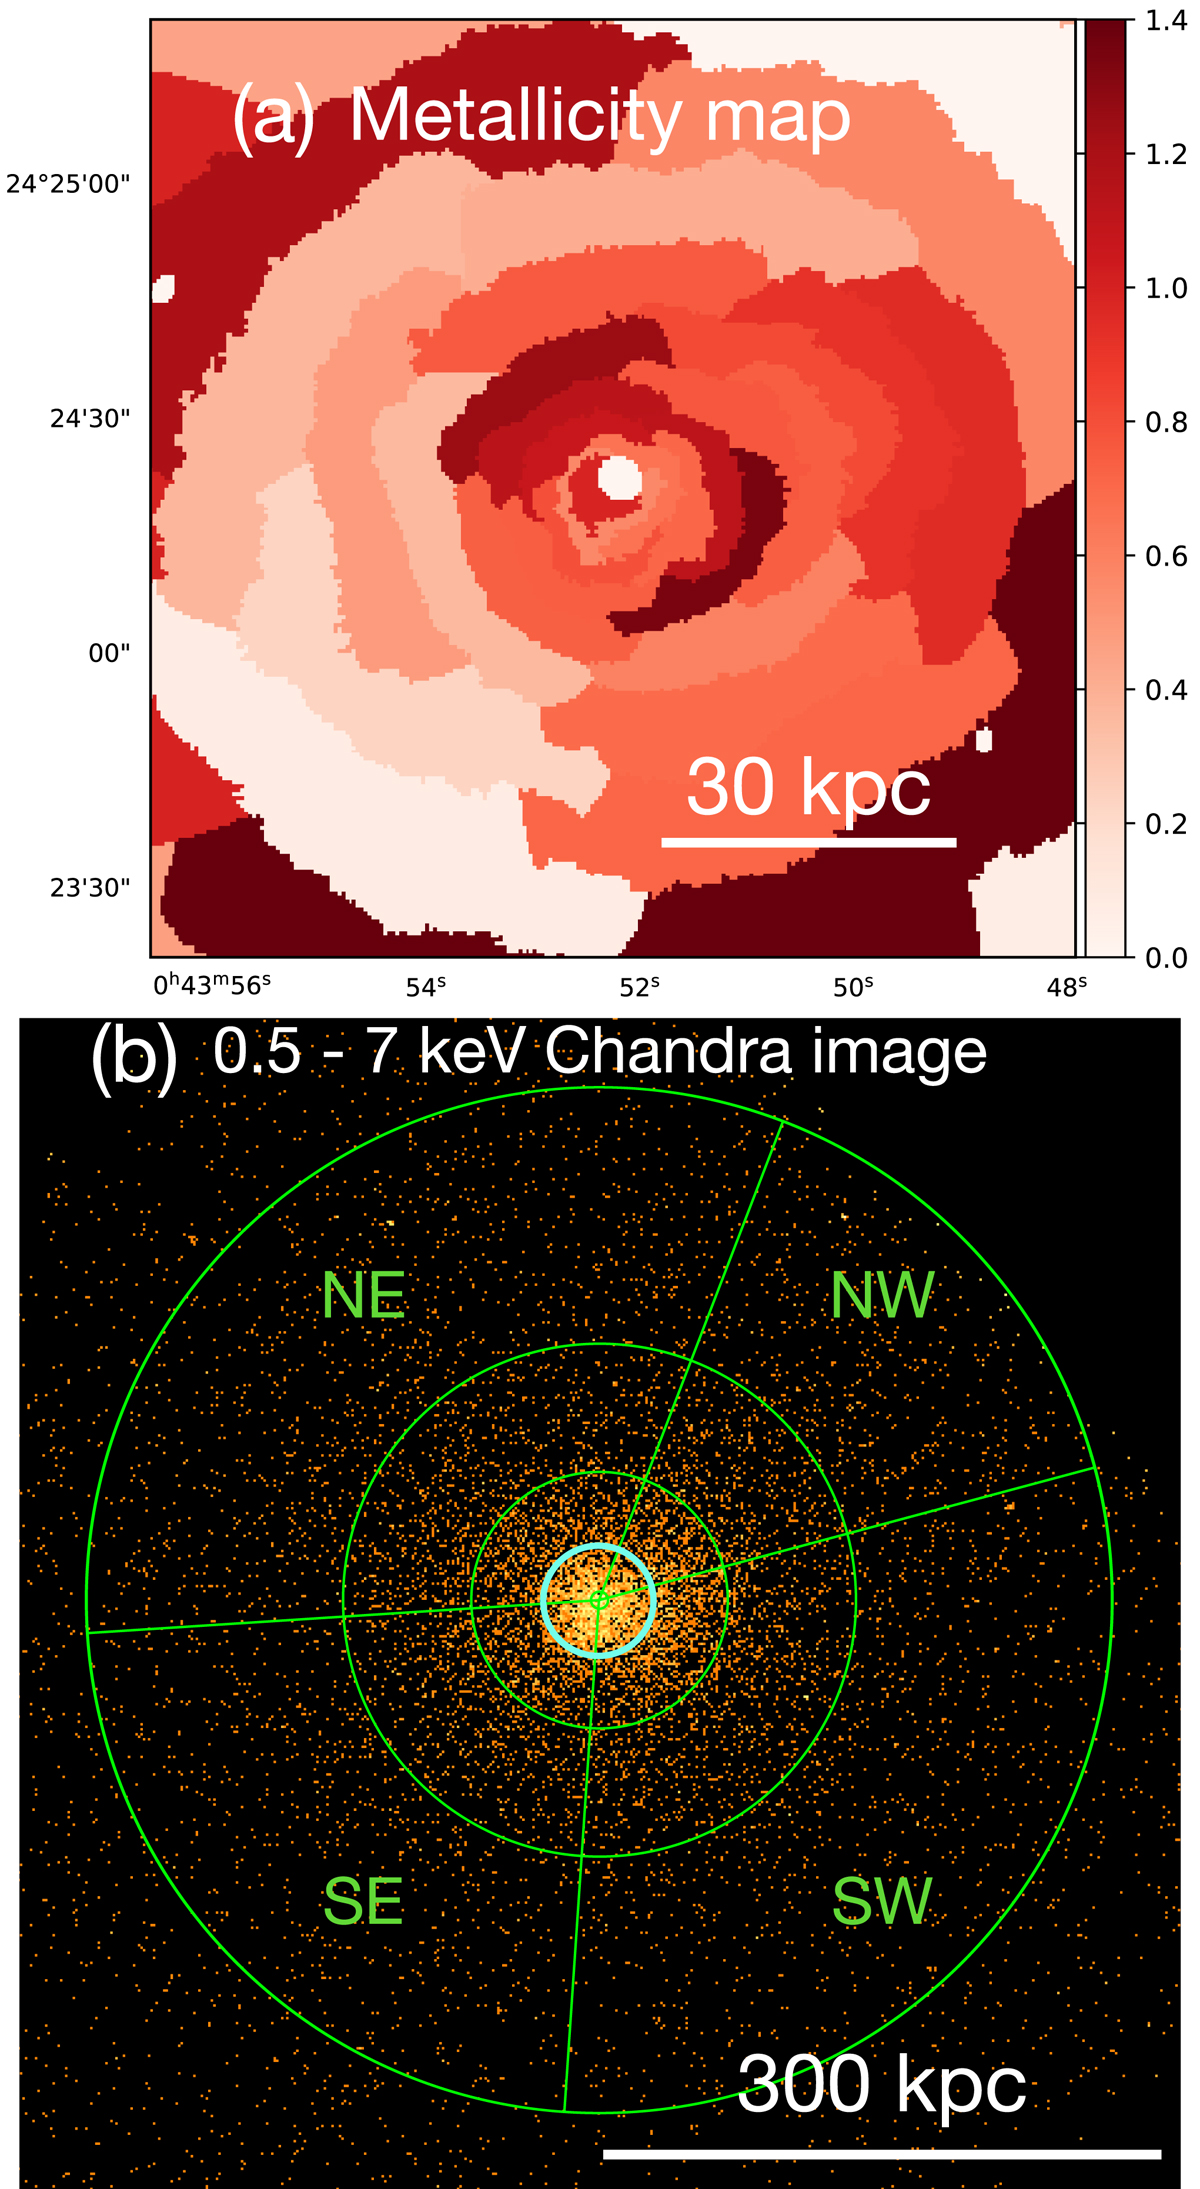
Fig. 7.
Download original image
Metal distribution in the ICM. Panel a: metallicity map of ZwCl 235 (see Sect. 4.2 for details on how the map was built), showing two metal rich arcs in the NE–SW direction at roughly 20 kpc from the center. The relative error is ∼30%. Panel b: 0.5−7 keV raw Chandra image of ZwCl 235. The green sectors correspond to the regions used to study the azimuthal and radial variation of abundances in the ICM (see Sect. 4.5 and Table 4). The metal-rich arcs visible in panel a are located within the innermost cyan circle.
Current usage metrics show cumulative count of Article Views (full-text article views including HTML views, PDF and ePub downloads, according to the available data) and Abstracts Views on Vision4Press platform.
Data correspond to usage on the plateform after 2015. The current usage metrics is available 48-96 hours after online publication and is updated daily on week days.
Initial download of the metrics may take a while.