Fig. 6.
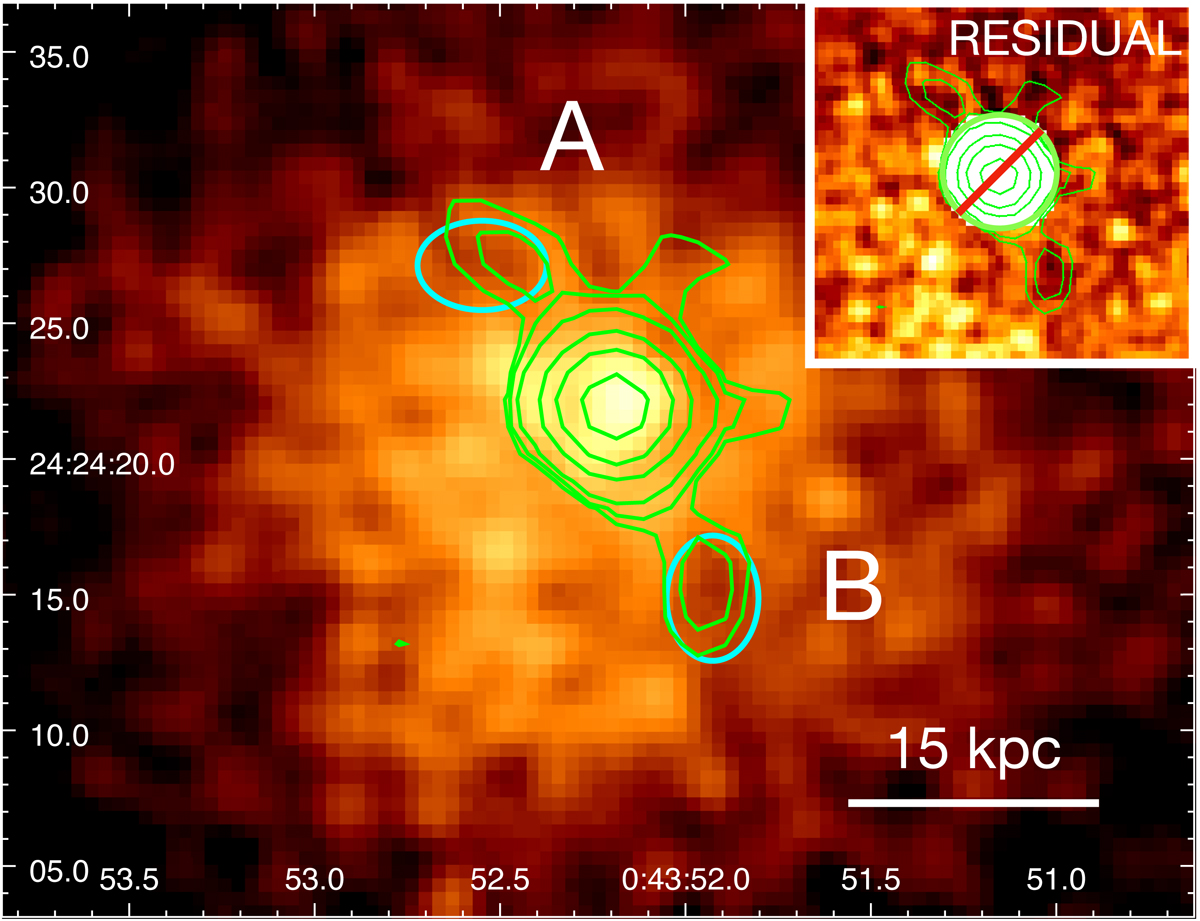
Download original image
X-ray depressions in the ICM. Main panel: Chandra image (0.5−7 keV) of the galaxy cluster core, smoothed with a Gaussian of kernel size 1.5″. The overlaid green contours represent the emission of the central radio galaxy at 3 GHz (same as in Fig. 1), while the cyan ellipses show the position of the putative X-ray cavities discussed in Sect. 4.4. Upper zoom-in: double β-model residual image (see Sect. 4.3), showing depressions at the position of the NE–SW radio lobes (contours match those of the main panel). The white barred central region is caused by the excision of the inner 3″ from the image during fitting.
Current usage metrics show cumulative count of Article Views (full-text article views including HTML views, PDF and ePub downloads, according to the available data) and Abstracts Views on Vision4Press platform.
Data correspond to usage on the plateform after 2015. The current usage metrics is available 48-96 hours after online publication and is updated daily on week days.
Initial download of the metrics may take a while.