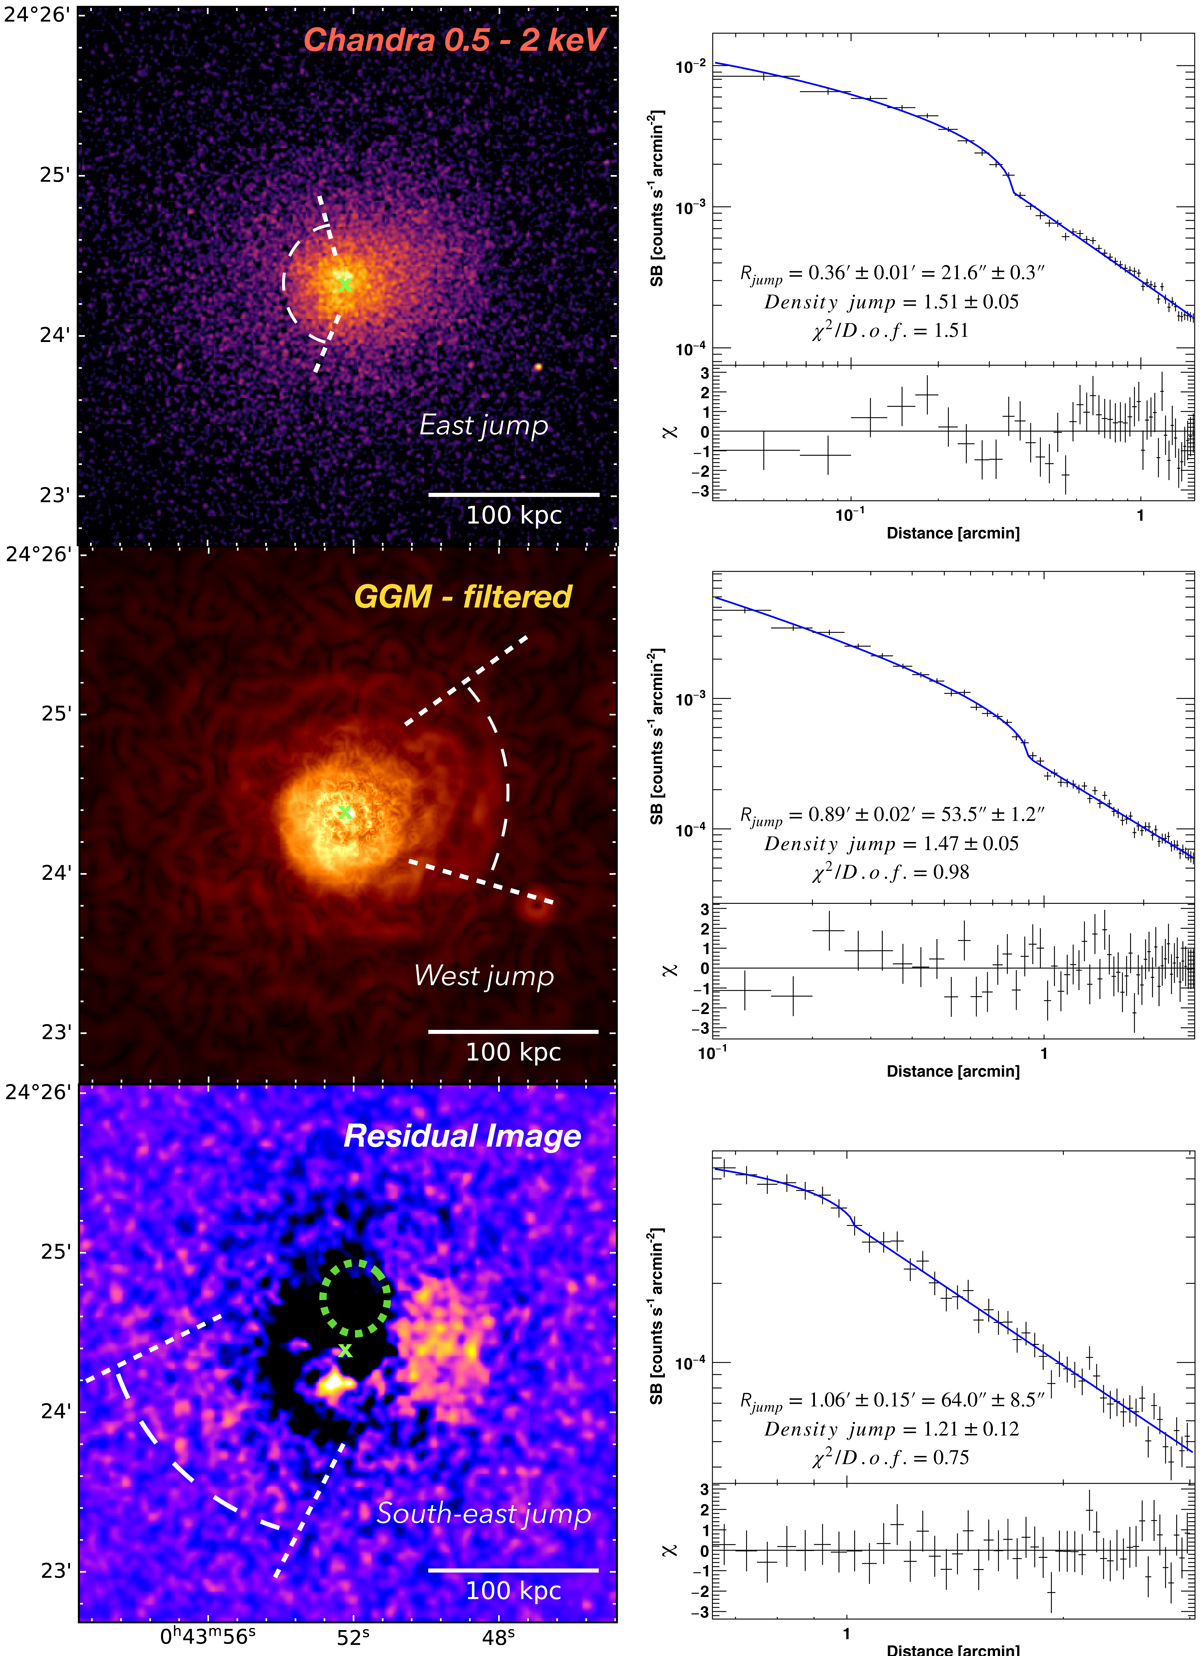
Fig. 5.
Download original image
Surface brightness edges in ZwCl 235. Left panels: from top to bottom, 0.5−2 keV band Chandra image of ZwCl 235, GGM-filtered image, and double β-model residual image (see Sect. 4.3). White dashed arcs mark the positions of the edges, white dashed lines show the opening angles of the sectors used for the spectral analysis, and the green cross indicates the position of the BCG. In the residual image, the green dashed ellipse indicates the X-ray depression identified by Shin et al. (2016) (see Sect. 4.4). Right panels: from top to bottom, surface brightness profiles across the east, west and SE edges. In each panel, the best-fit broken power-law model is overlaid in blue and detailed in the text, while the residuals are shown in the lower boxes.
Current usage metrics show cumulative count of Article Views (full-text article views including HTML views, PDF and ePub downloads, according to the available data) and Abstracts Views on Vision4Press platform.
Data correspond to usage on the plateform after 2015. The current usage metrics is available 48-96 hours after online publication and is updated daily on week days.
Initial download of the metrics may take a while.