Fig. 4.
Download original image
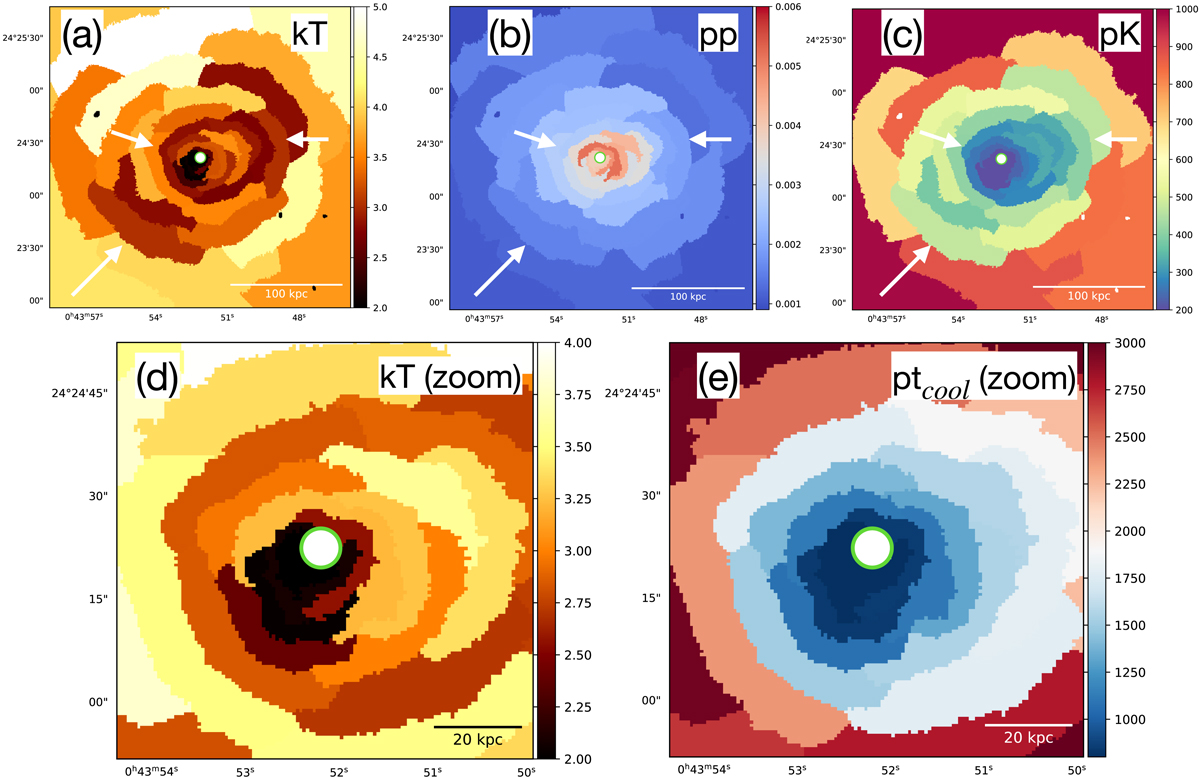
Spectral maps of the ICM in ZwCl 235 (see Sect. 4.2 for details). Upper panels: the temperature (keV), pseudo-pressure (arbitrary units) and pseudo-entropy (arbitrary units) maps are shown. Relative errors are on the order of ∼20%. The overlaid white arrows mark the positions of the surface brightness edges discussed in Sect. 4.3. Lower panels: the zoomed temperature map (keV) and the pseudo-cooling time map (arbitrary units) show the distribution of the cold gas in the inner ∼50 kpc. In all panels, the white-filled, green circle marks the extent of the central X-ray source (see Sect. 4.6).
Current usage metrics show cumulative count of Article Views (full-text article views including HTML views, PDF and ePub downloads, according to the available data) and Abstracts Views on Vision4Press platform.
Data correspond to usage on the plateform after 2015. The current usage metrics is available 48-96 hours after online publication and is updated daily on week days.
Initial download of the metrics may take a while.