Fig. 3.
Download original image
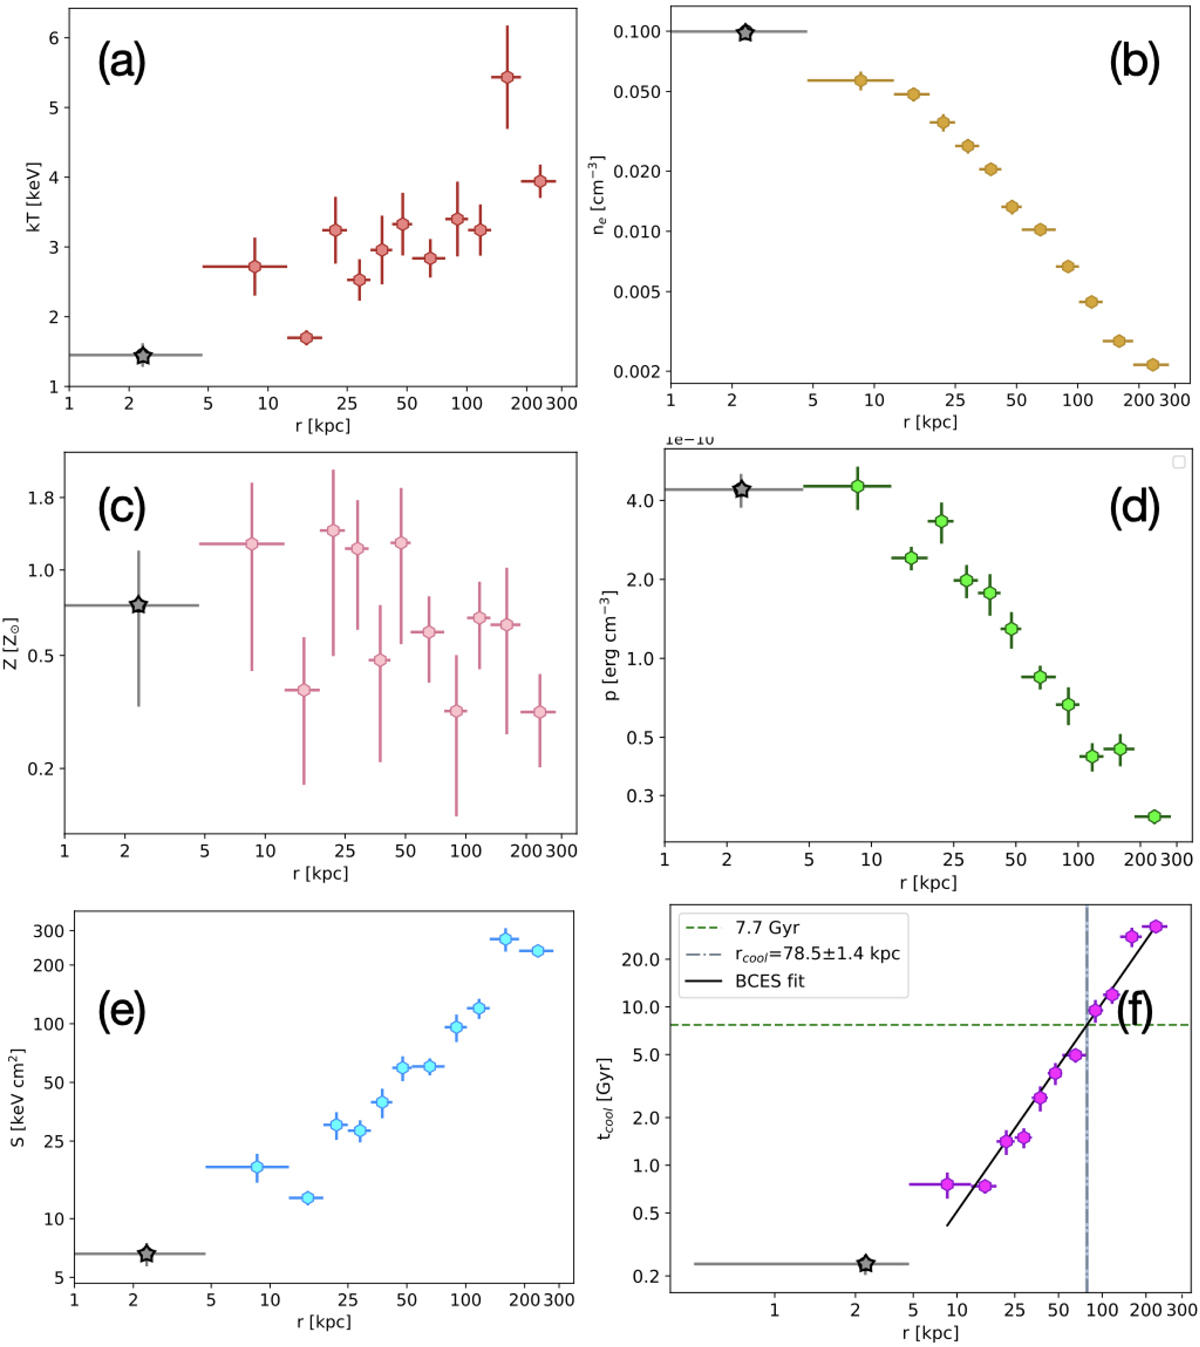
Circles: deprojected thermodynamic profiles of the ICM in ZwCl 235 between 3″–180″ (for details on the spectral extraction and fitting see Sect. 4.2); star: the innermost gray point in each plot is obtained from the spectral analysis of the inner 3″ of the cluster (for details see Sect. 4.6). Panel a: temperature profile. Panel b: electron density profile. Panel c: abundances profile. Panel d: pressure profile. Panel e: entropy profile. Panel f: cooling time profile, with the best fit power law over the radial range 3″–180″ overlaid in black, the tcool = 7.7 Gyr threshold shown with a green dashed line and the cooling radius shown with a gray line. The fit has been performed using BCES (Akritas & Bershady 1996).
Current usage metrics show cumulative count of Article Views (full-text article views including HTML views, PDF and ePub downloads, according to the available data) and Abstracts Views on Vision4Press platform.
Data correspond to usage on the plateform after 2015. The current usage metrics is available 48-96 hours after online publication and is updated daily on week days.
Initial download of the metrics may take a while.