Fig. 2.
Download original image
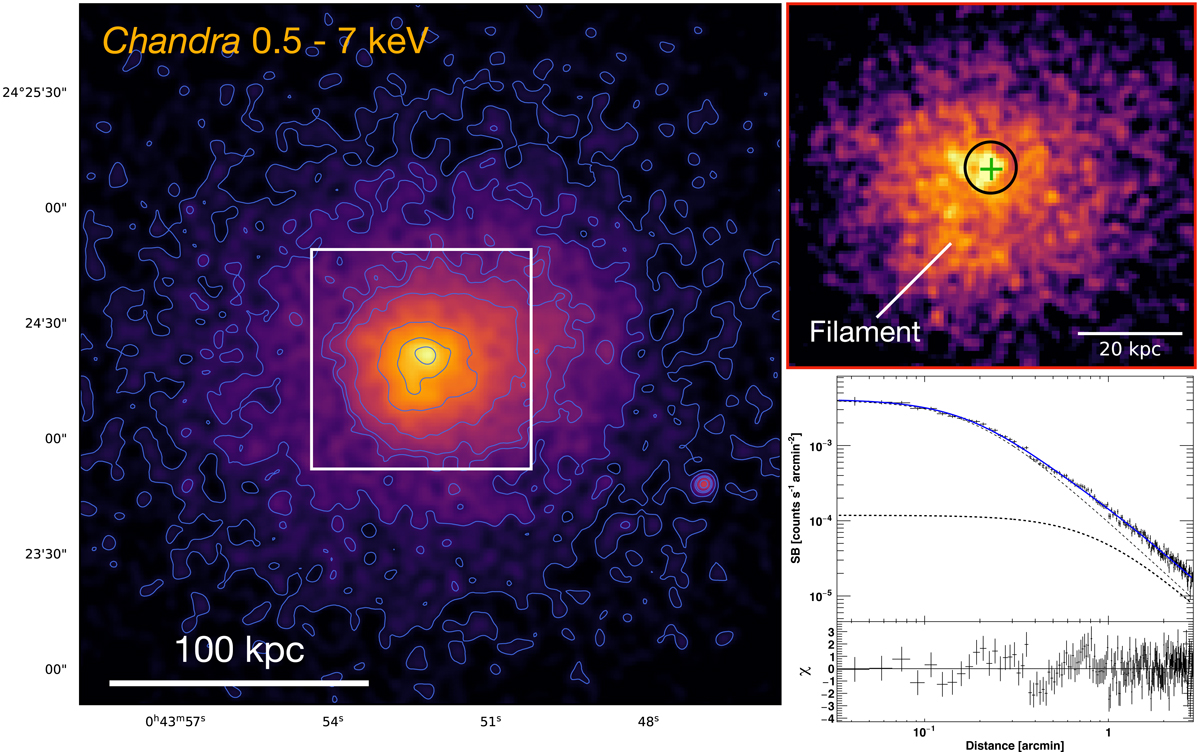
Chandra view of ZwCl 235. Left panel: 0.5−7 keV band background subtracted, exposure corrected Chandra image of ZwCl 235, centered on the BCG. The image is smoothed with a Gaussian of kernel size 3″. Blue contours are spaced by a factor of 1.5, with the highest being 6 × 10⁻⁷ cts s−1 cm−2. The white box indicates the size of the zoom-in on the right. Right upper panel: zoom-in of the Chandra image in the left panel, smoothed with a Gaussian of kernel size 1.5″. The green cross marks the BCG center, and the black circle shows the size of the region excised from the surface brightness radial profile. The position of the bright filament discussed in Sects. 4.2 and 4.7 is indicated. Right lower panel: surface brightness profile of ZwCl 235, with the best fit double β model overplot with a blue line (dotted black lines represent the contributions of the two β models). The residuals are shown in the lower box.
Current usage metrics show cumulative count of Article Views (full-text article views including HTML views, PDF and ePub downloads, according to the available data) and Abstracts Views on Vision4Press platform.
Data correspond to usage on the plateform after 2015. The current usage metrics is available 48-96 hours after online publication and is updated daily on week days.
Initial download of the metrics may take a while.