Fig. 10.
Download original image
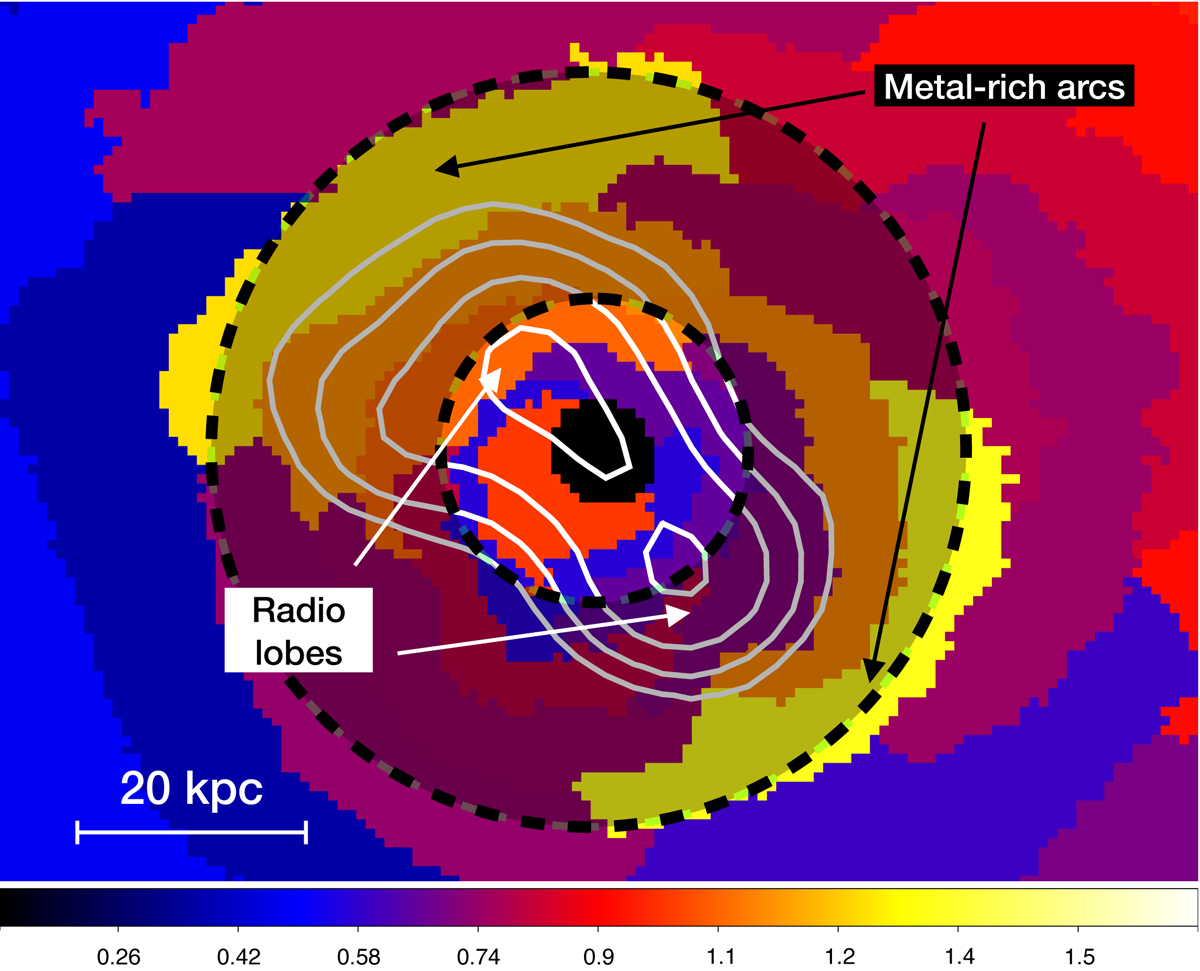
Zoom-in of the metallicity map shown in Fig. 7. White contours show the central radio galaxy at 144 MHz (levels are the same of Fig. 1). The translucent black area within the black dashed circles shows the predicted location of the iron radius (see text for details), which matches the position of the metal-rich arcs. The black central region corresponds to the BCG, whose X-ray emission was excluded in creating ICM spectral maps (see Sects. 4.2 and 4.6).
Current usage metrics show cumulative count of Article Views (full-text article views including HTML views, PDF and ePub downloads, according to the available data) and Abstracts Views on Vision4Press platform.
Data correspond to usage on the plateform after 2015. The current usage metrics is available 48-96 hours after online publication and is updated daily on week days.
Initial download of the metrics may take a while.