Open Access
Fig. 7
Download original image
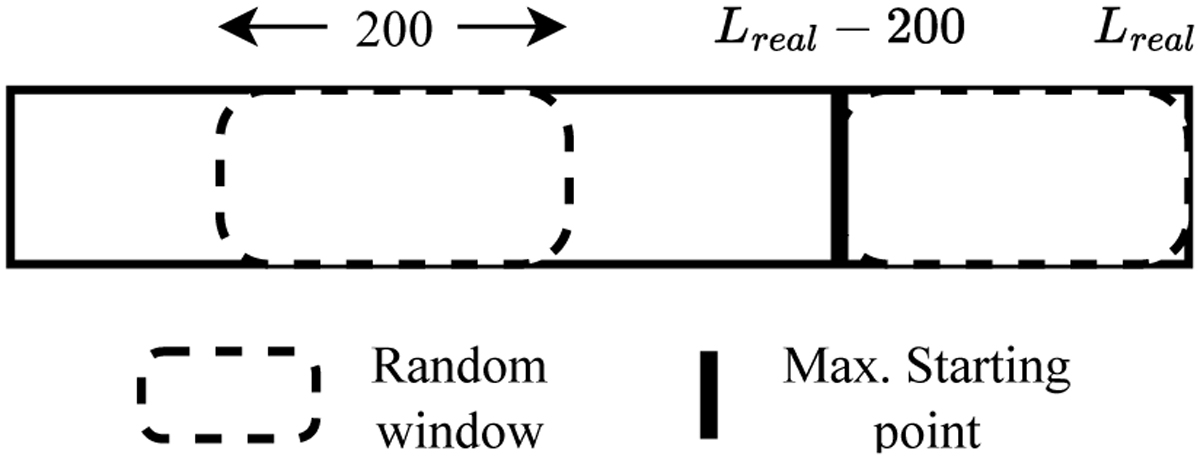
Windows sampling diagram. The rectangle represents the entire light curve whose length is Lreal. The dashed line denotes the sampled windows of size 200 observations. Windows are randomly generated along the light curve. However, we constrain the starting point to be smaller than Lreal − 200.
Current usage metrics show cumulative count of Article Views (full-text article views including HTML views, PDF and ePub downloads, according to the available data) and Abstracts Views on Vision4Press platform.
Data correspond to usage on the plateform after 2015. The current usage metrics is available 48-96 hours after online publication and is updated daily on week days.
Initial download of the metrics may take a while.