Fig. 5
Download original image
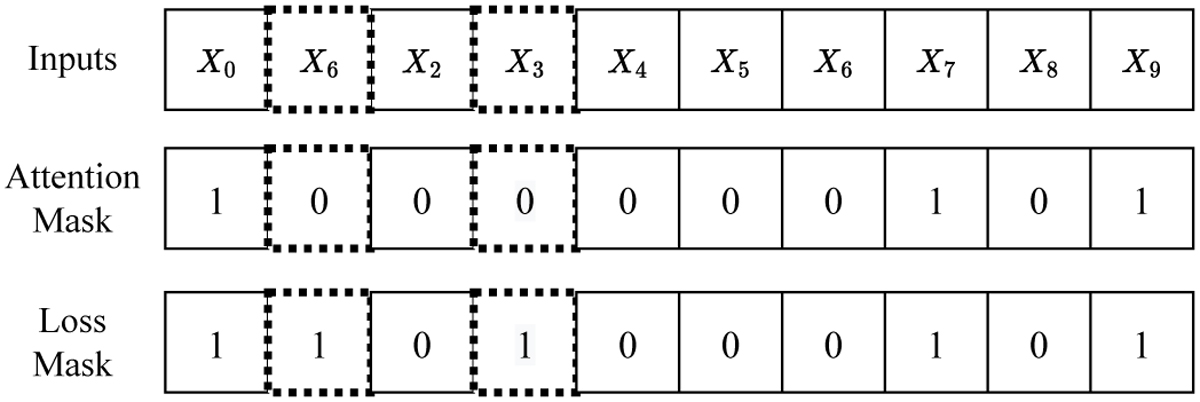
Final input composition. Following the example in Fig. 4, 20% of the masked values are replaced by random magnitudes while changing the “1”s in the attention mask vector to “0”s. Similarly, we make another 20% of the masking visible, keeping the actual observations. Doted-line squares indicate both random and real observations. At this point, we should keep a second mask containing the initial 50% masked values to evaluate the loss function.
Current usage metrics show cumulative count of Article Views (full-text article views including HTML views, PDF and ePub downloads, according to the available data) and Abstracts Views on Vision4Press platform.
Data correspond to usage on the plateform after 2015. The current usage metrics is available 48-96 hours after online publication and is updated daily on week days.
Initial download of the metrics may take a while.