Fig. 11
Download original image
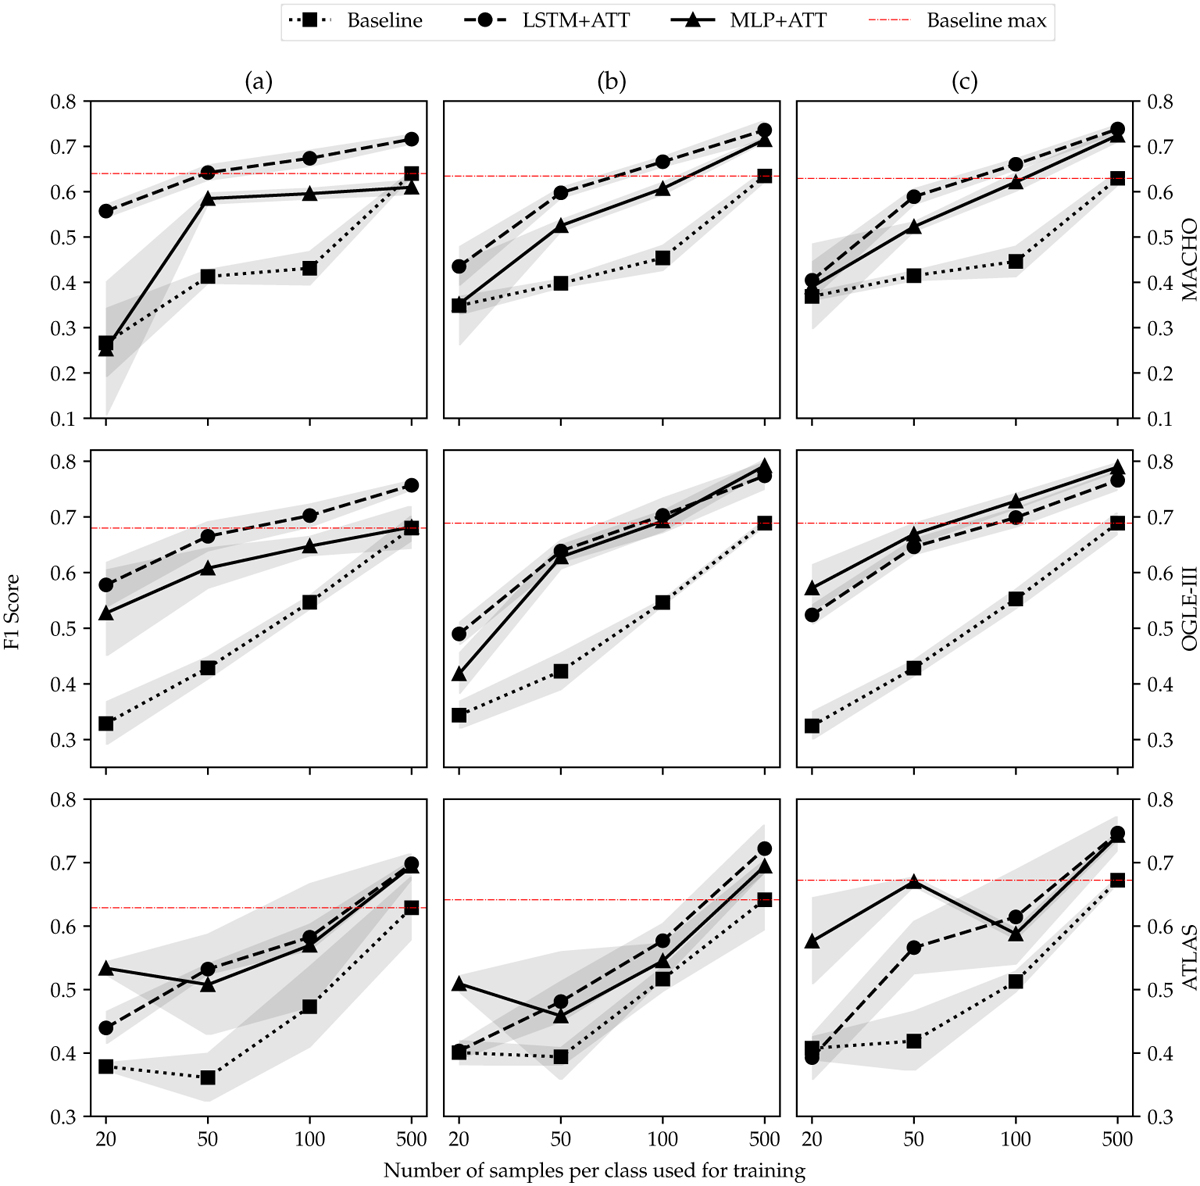
Testing Fl scores for an LSTM trained on light curves directly (baseline) and models trained on ASTROMER embeddings (LSTM+ATT and MLP+ATT). The gray shading represents the standard deviation of the three cross-validation split. Each row corresponds to the experiments on each survey, MACHO, OGLE, and ATLAS, respectively. In (a), we fine-tune ASTROMER and optimize classifiers on smaller subsets of 20, 50, 100, and 500 samples per class. The weights of ASTROMER are kept frozen when classifying. However, in (b), we allow gradients to flow into ASTROMER. The third case, (c), shows the results of fine-tuning with the entire set of light curves and classifying on smaller subsets, training ASTROMER simultaneously.
Current usage metrics show cumulative count of Article Views (full-text article views including HTML views, PDF and ePub downloads, according to the available data) and Abstracts Views on Vision4Press platform.
Data correspond to usage on the plateform after 2015. The current usage metrics is available 48-96 hours after online publication and is updated daily on week days.
Initial download of the metrics may take a while.