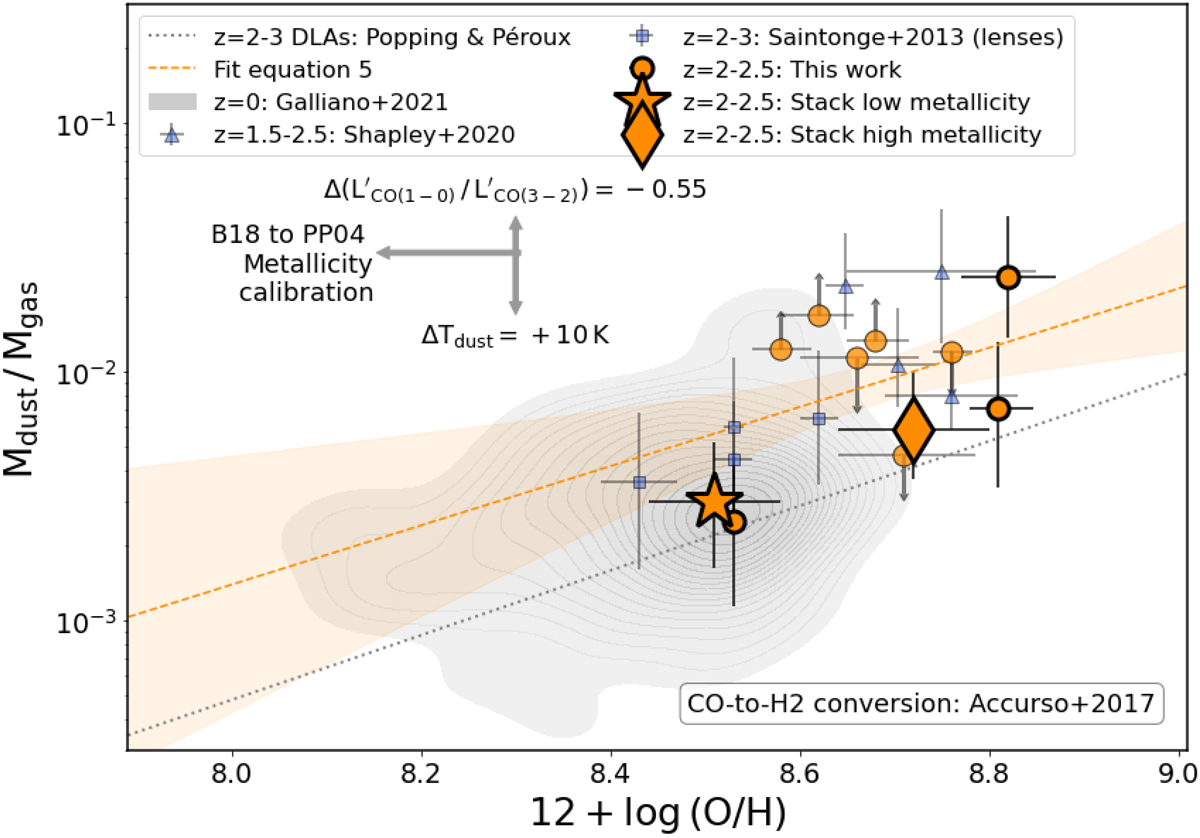
Fig. 4.
Download original image
DTG of galaxies as a function of their metallicity. The orange circles correspond to the individual galaxies presented in this work and the orange star and diamond to the stacks. Circles with upward or downward pointing arrows correspond to 2σ limits for the non-detections. A z > 1.5 literature compilation from Saintonge et al. (2013) and Shapley et al. (2020) is shown with blue squares and circles, respectively. The dashed orange line and shaded area around it, indicating the one-sigma uncertainty, correspond to the fit presented in Eq. (5). Overplotted is the best fit relation presented by Popping & Péroux (2022), based on absorption studies of damped Lyman-α absorbers. A z = 0 compilation taken from Galliano et al. (2021) is plotted as a grey-shaded area, and we include the De Vis et al. (2019) fit to local luminous galaxies as a dashed black line. The arrows included in the figure mark the systematic uncertainty introduced when adopting other assumptions for the dust temperature, metallicity calibration, and CO excitation properties of the galaxies.
Current usage metrics show cumulative count of Article Views (full-text article views including HTML views, PDF and ePub downloads, according to the available data) and Abstracts Views on Vision4Press platform.
Data correspond to usage on the plateform after 2015. The current usage metrics is available 48-96 hours after online publication and is updated daily on week days.
Initial download of the metrics may take a while.