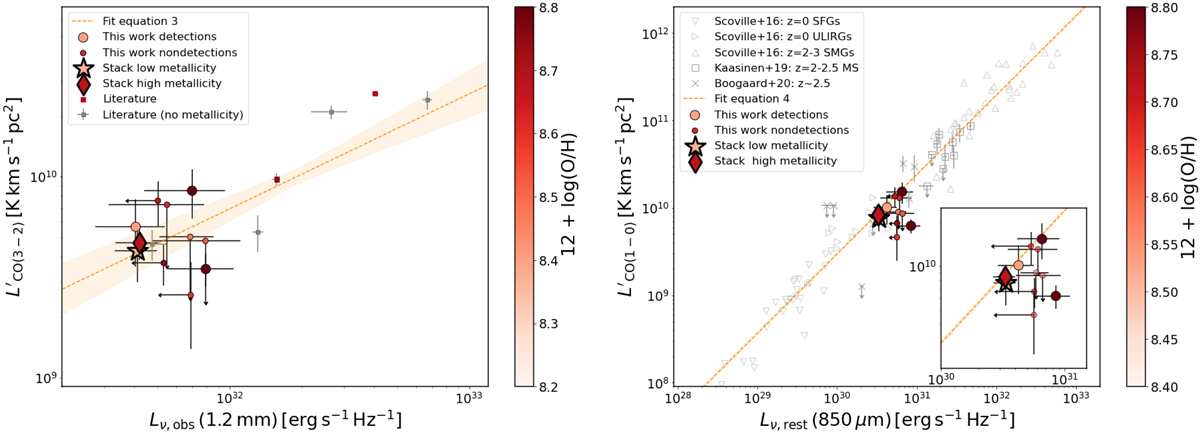
Fig. 3.
Download original image
Left: CO J = 3 − 2 luminosity as a function of 1.2 mm luminosity for our sample of galaxies and the low- and high-metallicity stacks, compared with a compilation taken from Boogaard et al. (2020), Popping et al. (2017), and Talia et al. (2018). The dashed orange line and shaded area around it, indicating the one-sigma uncertainty, correspond to the fit presented in Eq. (3). Right: CO J = 1 − 0 luminosity of our sample of galaxies (assuming r1 − 0/3 − 2 = 1.8) as a function of the 850 μm rest-frame luminosity (calculated assuming a thin grey body with β = 1.5 and Tdust = 25 K), compared with a sample of local and high-redshift galaxies from Scoville et al. (2016) and z = 1 − 2 galaxies from Kaasinen et al. (2019) and Boogaard et al. (2020). The dashed orange line and shaded area around it (note that the uncertainty range is very narrow) correspond to the fit presented in Eq. (4). In both panels the galaxies are colour-coded based on their metallicity, when available.
Current usage metrics show cumulative count of Article Views (full-text article views including HTML views, PDF and ePub downloads, according to the available data) and Abstracts Views on Vision4Press platform.
Data correspond to usage on the plateform after 2015. The current usage metrics is available 48-96 hours after online publication and is updated daily on week days.
Initial download of the metrics may take a while.