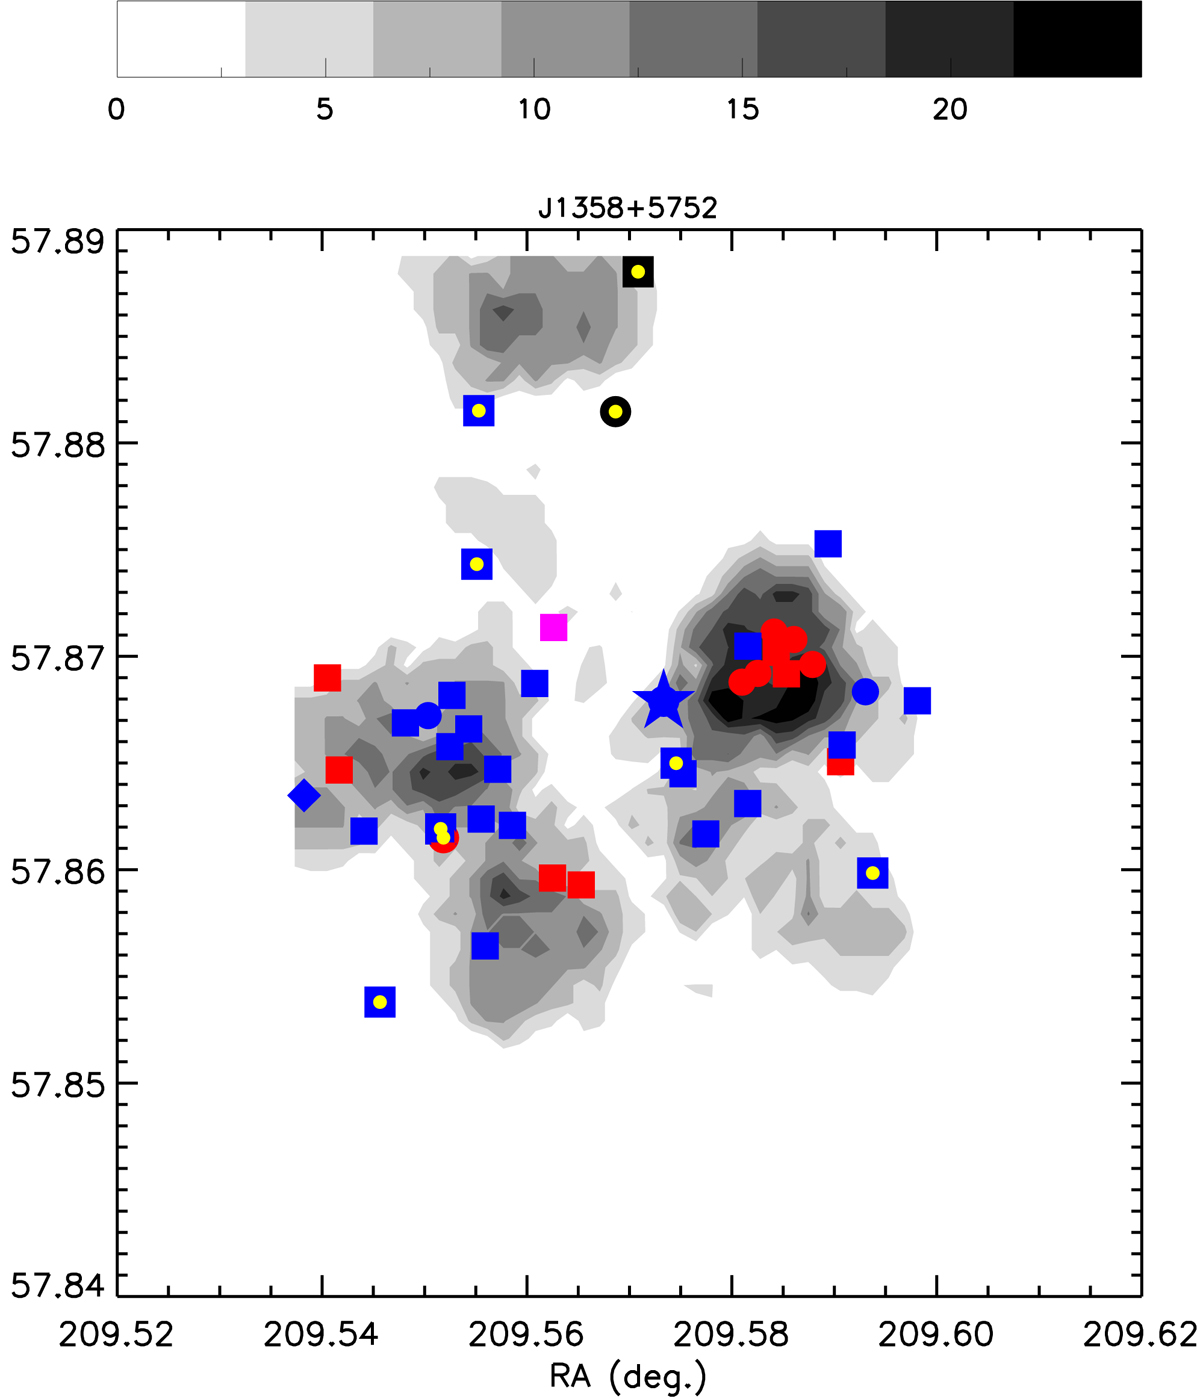
Fig. 1.

Download original image
Selected high-density regions for CARLAJ1358+5752 at z = 1.368. Passive and active galaxies are shown in red and blue, respectively. ETGs are shown as circles. LTG are shown as squares (disks) and diamonds (irregulars). The cluster spectroscopic members are marked by a small yellow circle, when they are black they are not included in our magnitude, colour and spatial selection but are shown to better explain our overdensity selection. The RLQ is shown as a star. The bar shows S/N levels.
Current usage metrics show cumulative count of Article Views (full-text article views including HTML views, PDF and ePub downloads, according to the available data) and Abstracts Views on Vision4Press platform.
Data correspond to usage on the plateform after 2015. The current usage metrics is available 48-96 hours after online publication and is updated daily on week days.
Initial download of the metrics may take a while.


