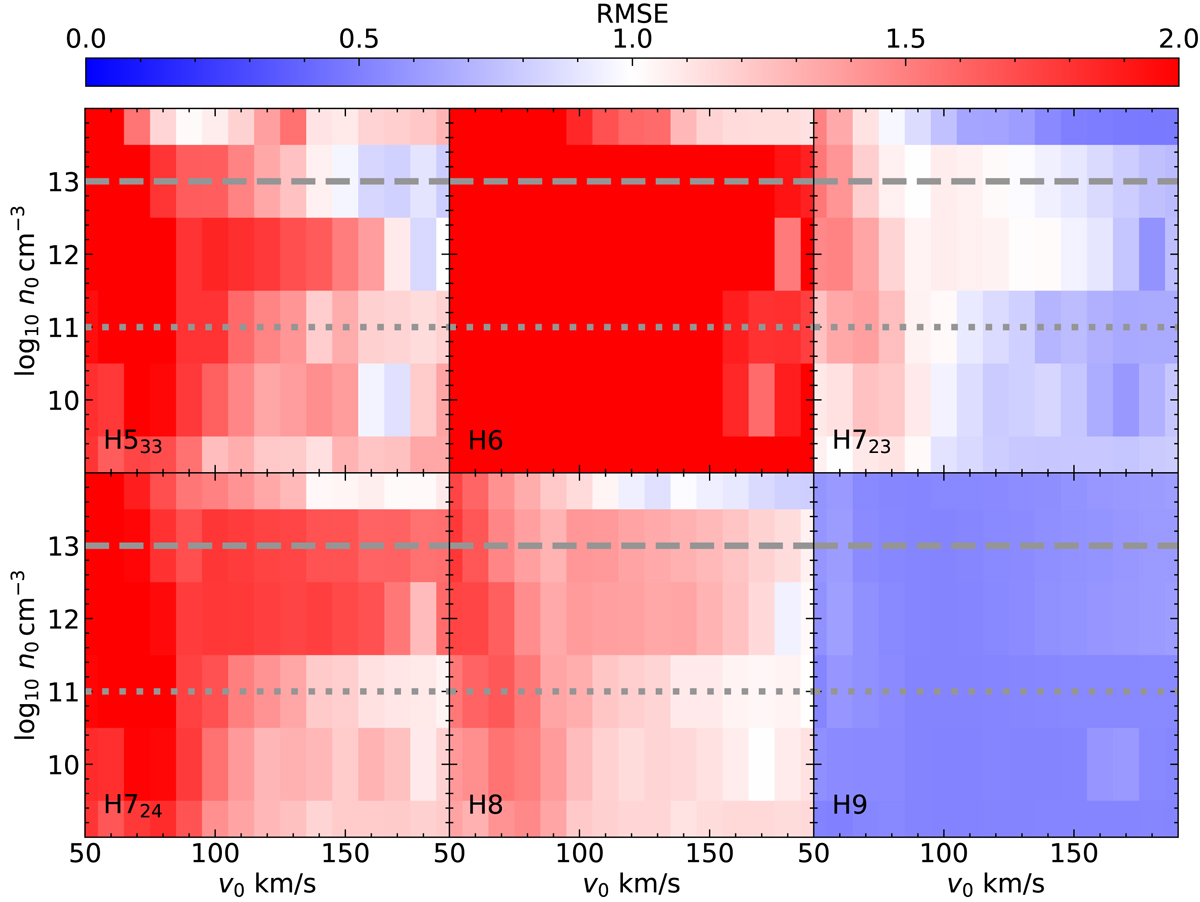
Fig. B.8.

Download original image
Root mean square error (RMSE; common colour scale on top), for the analysis described in Sect. 3.2, using the shock models of Aoyama et al. (2018, 2020, 2021). The two input parameters are the pre-shock gas velocity v0 and the number density of hydrogen nuclei n0. The smaller the RMSE is, the better the fit with the one-sigma regions (RMSE ≲ 1; Eq. (3)) in blue. Upper panels: H533, H6, and H723. Lower panels: H724, H8, and H9. The dashed and dotted horizontal lines indicate n0 = 1013 cm−3 and n0 = 1011 cm−3, respectively. At higher densities (n0 ≳ 1013 cm−3), both the NC and BC of the data are reproduced by the model, while the lower density only accurately reproduces the NC. The lack of constraints on the parameters from the H9 line is likely due to the low line-S/N.
Current usage metrics show cumulative count of Article Views (full-text article views including HTML views, PDF and ePub downloads, according to the available data) and Abstracts Views on Vision4Press platform.
Data correspond to usage on the plateform after 2015. The current usage metrics is available 48-96 hours after online publication and is updated daily on week days.
Initial download of the metrics may take a while.


