| Issue |
A&A
Volume 669, January 2023
|
|
|---|---|---|
| Article Number | L7 | |
| Number of page(s) | 5 | |
| Section | Letters to the Editor | |
| DOI | https://doi.org/10.1051/0004-6361/202245358 | |
| Published online | 09 January 2023 | |
Analysis of the first infrared spectrum of quasi-bound H2 line emission in Herbig-Haro 7
1
Sorbonne Université, Observatoire de Paris, PSL University, CNRS, LERMA, 5 place Janssen, 92190 Meudon Cedex, France
e-mail: This email address is being protected from spambots. You need JavaScript enabled to view it.
2
Armagh Observatory and Planetarium, College Hill, Armagh BT61 9DB, Northern Ireland
e-mail: This email address is being protected from spambots. You need JavaScript enabled to view it.
3
Gemini Obsevatory/NSF’s NOIRLab, 670 N. A’ohoku Place, Hilo, HI 96720, USA
e-mail: This email address is being protected from spambots. You need JavaScript enabled to view it.
Received:
2
November
2022
Accepted:
20
December
2022
Abstract
Context. Highly excited molecular hydrogen (H2) has been observed in many regions of shocked molecular gas. A recently published K-band spectrum of Herbig-Haro 7 (HH7) contains several vibration-rotation lines of H2 from highly excited energy levels that have not been detected elsewhere, including a line at 2.179 μm identified as arising from the v = 2, J = 29 level, which lies above the dissociation limit of H2. One emission line at 2.104 μm in this spectrum was unidentified.
Aims. We aim to complete the analysis of the spectrum of HH7 by including previously missing molecular data that have been recently computed.
Methods. We re-analysed the K-band spectrum, emphasising the physics of quasi-bound upper levels that can produce infrared emission lines in the K band.
Results. We confirm the identification of the 2 − 1 S(27) line at 2.1785 μm and identify the line at 2.1042 μm as due to the 1−0 S(29) transition of H2, whose upper level energy is also higher than the dissociation limit. This latter identification, its column density, and the energy of its upper level further substantiate the existence of a hot thermal component at 5000 K in the HH7 environment.
Conclusions. The presence of the newly identified 1 − 0 S(29) line, whose quasi-bound upper level (v = 1, J = 31) has a significant spontaneous dissociation probability, shows that dissociation of H2 is occurring. The mechanism by which virtually all of the H2 in levels with energies from 20 000 K to 53 000 K is maintained in local thermodynamic equilibrium at a single temperature of ∼5000 K remains to be understood.
Key words: astrochemistry / molecular data / ISM: molecules / ISM: jets and outflows
© The Authors 2023
 Open Access article, published by EDP Sciences, under the terms of the Creative Commons Attribution License (https://creativecommons.org/licenses/by/4.0), which permits unrestricted use, distribution, and reproduction in any medium, provided the original work is properly cited.
This article is published in open access under the Subscribe-to-Open model. This email address is being protected from spambots. You need JavaScript enabled to view it. to support open access publication.
1. Introduction
The interaction of the collimated outflow from the protostar SSV13 (Strom et al. 1976) and the molecular cloud out of which it formed has produced a collection of Herbig-Haro (HH) objects, HH7-HH11, in a more or less linear arrangement on the sky. The most distant of these from SSV13, HH7, has a classic bow shock shape. It is bright in line emission from shock-excited vibrational states of molecular hydrogen (H2), first observed in the v = 1 − 0 S(1) transition by Zealey et al. (1984), Hartigan et al. (1989), and Garden et al. (1990) and subsequently in vibrational levels 0 − 4 and rotational levels 1 − 15 by Burton et al. (1989) and Fernandes & Brand (1995). HH7 also emits strongly in pure rotational lines of H2 and CO (Neufeld et al. 2006; Yuan & Neufeld 2011; Neufeld et al. 2019; Molinari et al. 2000) as well as in [OI]63μ (Sperling et al. 2020), Hα, [OI]λ6300, and [SII]λ6716 (Hartigan et al. 2019). The vibrationally excited H2 lines, observed mainly in the 2.0 − 2.5 μm interval, are emitted predominantly in the hottest shock-heated gas, while the pure rotational low-J transitions of H2 and the pure rotational transitions of CO, observed in the mid- and far-infrared, arise in a somewhat cooler gas downstream.
Much more highly vibrationally and rotationally excited molecular hydrogen was found by Pike et al. (2016, hereafter P16) in a 3″ × 3″ region near the tip of the HH7 bow shock, in K-band spectra they obtained at a resolving power, R, of 5000. Figure 6 of their paper shows the 2.01 − 2.45 μm spectrum of a 0 6 × 0
6 × 0 9 area in that region. Their paper demonstrated the existence in HH7 of a small percentage (1.5%) of the emitting H2 at a temperature of ∼5000 K. Subsequently, Geballe et al. (2017) discovered the presence of small percentages of 5000 K H2 in shocked gas at several locations in the Orion Molecular Cloud. Giannini et al. (2015) detected a similar phenomenon in another bright HH object, HH1, at a somewhat higher temperature, ∼6300 K.
P16 identified a weak emission line at 2.179 μm in the HH7 spectrum as the 2 − 1 S(27) transition of H2, which arises from the upper level, v = 2, J = 29, whose energy is above the dissociation limit of the ground state of H2; this corresponds to 51965.84 K, using the latest measurements (Hölsch et al. 2019) and the Committee on Data for Science and Technology (CODATA) definition of fundamental constants (Tiesinga et al. 2021). The column density of H2 in the upper level could only be crudely estimated by P16, as the Einstein A coefficient for that transition was not known. P16 also reported the detection of a faint line near 2.104 μm, which they were unable to identify.
Roueff & Abgrall (2022) have recently proposed a simple and efficient method for computing the emission spectrum produced by quasi-bound levels, providing accurate wavenumbers and Einstein emission coefficients. The application to H2 allowed them to calculate the Einstein coefficient of the 2−1 S(27) transition and suggested that the line at 2.104 μm in HH7 is the 1 − 0 S(29) transition of H2, whose upper-state energy also lies above the dissociation limit.
The present paper analyses these two high excitation lines in the light of the new theoretical developments. Section 2 revisits the observations of HH7, Sect. 3 summarises the recent theoretical achievements, and Sect. 4 contains the resulting extended observational analysis of the H2 line emission in HH7. We provide a discussion of our results in Sect. 5.
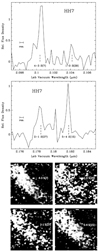 |
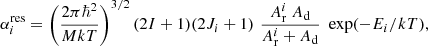
Fig. 1. Observational data showing highly excited H2 lines in HH7. Top two panels: spectra of a 0 |


2. Observations
A detailed description of the observations of HH7 and a reduction of the spectral data have been given by P16. In brief, the Gemini facility integral field spectrometer, the Near Infrared Field Spectrometer (NIFS; McGregor et al. 2003), was used at the Frederick C. Gillett Gemini North Telescope on Maunakea, Hawai’i, to obtain spectra of a 3″ × 3″ region near the tip of the HH7 bow shock, for program GN-2007B-Q-47. The angular resolution of the spectra was 0 35. Within this 3″ × 3″ region, the spectra showed H2 ro-vibrational line emission from upper-state levels covering a wide range of energies, including a dozen in the range 40 000 − 50 000 K. Because some rotational energies and associated rotational quantum numbers of the upper levels of these lines are high (J ≳ 15), collisions rather than the absorption of ultraviolet (UV) photons are probably the main producer of the populations in those rotational levels. Somewhat lower values of J associated with high vibrational quantum numbers are commonly found in dense photon-dominated regions (PDRs) such as NGC 2023, the Orion Bar, S140, and IC63. (Burton et al. 1992; McCartney et al. 1999; Kaplan et al. 2021). H2 is excited in PDRs by UV pumping, which is followed by electronic fluorescence, but the ΔJ = ±1 selection rule for electronic transitions maintains J at values below ∼131.
P16 concentrated their analysis on the spectrum of the 0 6 × 0
6 × 0 9 area shown in their Fig. 2; the spectrum is plotted in their Fig. 6. The upper two panels of our Fig. 1 show in more detail two 0.01 μm wide portions of that spectrum, each containing one of the two highly shock-excited H2 lines discussed in the Introduction. Wavelength calibration employed the spectrum of an argon lamp and is accurate to ∼0.00002 μm. The horizontal scales are vacuum laboratory wavelengths and as such can be directly compared with the theoretically calculated wavelengths (see Sect. 3). The uppermost panel contains the previously unidentified line at 2.1042 μm along with the nearby 4 − 3 S(7) line. Similarly, the middle panel contains the previously identified 2 − 1 S(27) line and the adjacent 5 − 4 S(15) line. Spectral images of the four lines, extracted from the NIFS data cube, are shown in the bottom panel of the figure and demonstrate that, to within the limits imposed by the noise levels, the four emission lines have identical morphologies, which also match the morphology of the strong 1 − 0 S(1) line shown in Fig. 2 of P16. Based on the fluctuations in the baseline, we estimate the confidence of the detection of the 1 − 0 S(29) line to be 3.5σ. The wavelengths of these two weak lines are slightly different than those reported by P16 and are more accurate.
3. Theoretical aspects
Molecular quasi-bound levels correspond to states whose energies lie above the dissociation limit of the ground state of the molecule but well below the dissociation energy of the electronically excited molecule. For H2, the Schrödinger equation relevant to excited rotational levels is
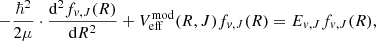 (1)
(1)
where 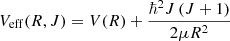 , with V(R) the ground state electronic molecular potential of H2 and μ = Mp/2 the nuclear reduced mass of H2.
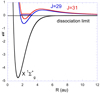 |
Fig. 2. H2 molecular potentials in eV as a function of the interatomic distance, R, expressed in atomic units. The zero value corresponds to photo-dissociated H2. The black curve is the electronic potential of the |

Figure 2 displays the electronic molecular potential of the  ground state of H2 as well as the effective potentials corresponding to J = 29 and J = 31, the two quasi-bound levels (sometimes referred to as shape resonances) previously mentioned. The presence of the centrifugal potential,
  , significantly modifies the shape of the electronic contribution, V(R), by reducing the potential well, shifting the minima to larger interatomic distances and exhibiting broad bump maxima above the dissociation limit, peaking near 4.5 atomic units.
Figure 2 also displays the resonant quasi-bound eigenvalues, Er, which are located above the dissociation limit and are trapped inside the centrifugal barrier. The associated wave function for each level has a non-vanishing probability in the interatomic range displayed, becomes vanishingly small after the second turning point when Er ≤ Veff(R), and has an oscillatory behaviour for large R when Er becomes larger than Veff(R). The associated quasi-discrete stationary states have complex energy eigenvalues, E = Er − (i Γ/2), where Er is the energy at resonance and Γ characterises the width of the level and determines its lifetime against dissociation, τ = ℏ/Γ, due to tunnelling from the quasi-bound to the continuum oscillatory dissociating state at large interatomic distances. Roueff & Abgrall (2022) computed the various resonance energy level positions of H2 and the corresponding emission spectrum arising from these levels by using the recent highly accurate molecular potential of the H2 ground state of Czachorowski et al. (2018) and extending the effective potential by a constant value from the maximum value of the potential function. This method allows one to use a standard numerical integration of the Schrödinger equation applied to strictly bound levels and has been demonstrated to be very precise for determining the resonant energy level positions and the emission rates. However, it does not allow a derivation of the widths or the dissociation lifetimes. Those are obtained through different methods based on scattering properties (Schwenke 1988; Selg 2010).
These computations predict wavelengths of 2.1785 μm for the 2 − 1 S(27) transition and 2.1042 μm for the 1 − 0 S(29) transition. The predicted wavelengths for the two stronger lines in Fig. 1 are 2.10043 μm for 4 − 3 S(7) and 2.18179 μm for 5 − 4 S(15). As can be seen in the figure, all are in excellent agreement with the observed wavelengths. Therefore, we are confident in the previous identification of the 2 − 1 S(27) line by P16 and in our identification of the weak and previously unidentified feature at 2.1042 μm as the 1 − 0 S(29) line. These two transitions are the only lines in the 2.01–2.45 μm interval from quasi-bound levels that would have been detectable in our data. (We note in Table 1 the small Einstein A coefficient of the 2 − 0 Q(29) line at 2.4007 μm.)
Properties of the two detected quasi-bound levels, v = 2, J = 29 and v = 1, J = 31, of H2 and their emission spectrum.
4. Column density analysis
The analysis undertaken here follows that described in P16 for the H2 line emission from HH7 reported in that paper, with the addition of the 1–0 S(29) and 2–1 S(27) lines presented here. A two-component Boltzmann distribution with temperatures Thot and Twarm was fitted to the column densities obtained from the de-reddened line intensities,
 (2)
(2)
with each component described by a Boltzmann distribution at the corresponding temperatures, as per P16. This is shown in Fig. 3.
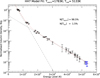 |
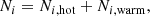
Fig. 3. Level column densities, divided by their degeneracies, Ni/gi, plotted as a function of level energy, Ti, for the H2 lines measured in HH7. They are normalised to unity for the (v, J)=(1, 3) upper-state level at 6952 K, which emits the 1–0 S(1) line. The two blue points (in the lower right) are for the newly analysed 2–1 S(27) and 1–0 S(29) lines. The dashed red line shows the best two-temperature LTE fit, as described in Sect. 4. |
We obtain Twarm = 1783 ± 20 K and Thot = 5133 ± 17 K, with 98.5% of the total column of excited H2 gas in the warm component of the gas and 1.5% in the hot component. This compares to values of Twarm = 1803 ± 12 K and Thot = 5200 ± 12 K found without these two extra lines included in the analysis2. The additional lever arm provided by the two higher excitation energy levels has only led to a marginal decrease in the derived temperatures; in other words, the result is essentially the same.
We conclude that the two quasi-bound H2 lines are well modelled by the same hot local thermodynamic equilibrium (LTE) component as per all lines measured in HH7 arising from energy levels ≥15 000 K. The level populations for the two quasi-bound lines are ∼10−5 times that of the v = 1, J = 3 upper level of the brightest H2 emission line, 1 − 0 S(1).
5. Discussion
Table 1 summarises the present knowledge available for the two quasi-bound levels of H2 v = 2, J = 29 and v = 1, J = 31, that have been detected. The upper level involved in the 2 − 1 S(27) transition at 2.1785 μm, 676 K above the dissociation energy of the ground state, is very stable against dissociation, whereas that of the 1 − 0 S(29) transition at 2.1042 μm, located 845 K higher, has a dissociation probability of approximately five percent and a dissociative lifetime, τd = ℏ/Γd, resulting from quantum tunnelling through the centrifugal barrier (see Fig. 2) of 4.083 × 10⁶ s, corresponding to less than two months. This indicates that the shock wave in HH7 is partially dissociative.
As shown in Fig. 3, the 5000 K component represents a small percentage of the line-emitting H2 in HH7. As noted previously, similar small percentages have been observed in HH1 and in the Orion molecular outflow. Figure 3 also shows that H2 in energy levels greater than ∼20 000 K above the ground state are populated only by this component. In the case of HH1, Giannini et al. (2015) observed a wide range of neutral and ionised species emitting in close proximity to the H2, many at optical wavelengths. Their analysis yields a temperature range of 8000 − 80 000 K to account for the emission. They further find that neutral and fully ionised regions coexist inside the shock. However, for the heavily extincted H2 line emission from HH7 (AV = 12 − 28 mag; P16), the species producing the optical emission lines observed by Solf & Boehm (1987), Hartigan et al. (1989); Hartigan et al. (2019) cannot be mixed with the H2.
In view of the detections by Giannini et al. (2015), P16, and Geballe et al. (2017) of 5000 − 6000 K H2 in diverse environments, it seems likely that a small percentage of H2 existing at those temperatures is a common occurrence in collisionally shocked molecular gas, at least in cases where collisions between outflows and ambient molecular material occur at velocities of many tens of km s−1, as is the case for HH1, HH7, and the Orion Molecular Cloud. In addition, although transitions emitted from quasi-bound levels have only been detected towards HH7, we expect that they are present in HH1 and OMC-1 at roughly the same intensities relative to the stronger H2 lines, as in HH7.
It is generally accepted that the maximum temperatures of nearly all of the vibrationally excited H2 in each of the above shocked clouds and in many others are suppressed by continuous shocks, in which the collisional acceleration of the ambient clouds and deceleration of the colliding outflows from the protostars are sufficiently gradual to heat the H2 only to temperatures of ∼2000 K and prevent its dissociation (for more details, see Sect. I of P16 and references therein). The existence of H2 at a range of lower temperatures in gas cooling behind the continuous shocks, which has been demonstrated by observations of pure rotational lines (e.g., Neufeld et al. 2019), is also unsurprising. However, it seems remarkable that virtually all of the highly ro-vibrationally excited H2 in levels with energies from 20 000 K to 53 000 K is maintained in LTE at a single temperature of ∼5000 K, and that there is virtually no H2 at temperatures between 2000 K and 5000 K. The mechanism that produces this bimodal temperature distribution is unclear.
The location and morphology of the 5000 K gas also is unclear. The gas could be located in thin (currently unresolvable) sheets where the molecular cloud is being collisionally accelerated, the wind is being collisionally decelerated, or both. Its line emission could alternatively also be occurring in small clumps of unusually hot and/or unusually dense gas scattered along the shock front. Comparisons of the velocity profiles of lines originating from levels whose populations are dominated by the gas at 5000 K with those from levels dominated by the 2000 K component, at higher spectral resolution than has been employed to date, might reveal small differences and constrain the relative locations of the two components. The good fit of the v = 1, J = 31 column density to the fit to the population–energy diagram (Fig. 3) indicates that dissociation is taking place in the 5000 K gas.
One can consider if the short lifetime of the v = 1, J = 31 quasi-bound level indicates a significant continuous reformation of molecular hydrogen in the gas phase at high temperatures. We have estimated the formation rate of H2 through radiative association via that resonance level, i, H + H ↔ H2i → H2 + hν, following the theory of Bain & Bardsley (1972), to be
 (3)
(3)
where Ad = 1/τ and M is the reduced mass of the colliding atoms. The contribution of v = 1, J = 31 with I = 1 and similar values of Ar and Ad is the most efficient by orders of magnitude. However, the derived value for its contribution at 5000 K is 1.37 × 10⁻³⁰ cm3 s−1, which is negligible.
Although it is difficult to assess the direct implication of the measurable presence of these quasi-bound H2 states for shock chemistry, their detections confirm the predictability of theoretical computations based on highly accurate potential curves. The physical conditions associated with the astrophysical environments in which their lines are emitted may not be reproducible in the laboratory due to their very large rotational quantum numbers. Thus, they probably offer the only way to probe these levels. Martin et al. (1996) introduced quasi-bound levels of H2 in their master equation studies of collisional excitation of H2 by H and specifically mentioned the v = 2, J = 29, and v = 1, J = 31 quasi-bound levels detected here. However, they find that the highly excited rotational levels are not thermally populated for the range of physical conditions that they considered, in contrast to what astronomical observations have revealed. Finally, we note that the contribution of quasi-bound levels to the partition function of H2 and its isotopologues has been recently computed by Zúñiga et al. (2021) using the same potential as us.
We contacted K. Kaplan to check if the two transitions at 2.1785 μm and 2.1042 μm were present in his PDR spectra obtained with the Immersion Grating INfrared Spectrometer (IGRINS), and they were not.
The errors quoted here are the formal errors derived from the least squares fit.
Acknowledgments
We thank K. Kaplan for having searched the two transitions in his IGRINS spectra of various PDRs. We are grateful to the referee for helpful comments. E.R. and H.A. acknowledge support by the Programme National de Physique et de Chimie du Milieu Interstellaire (PCMI) of CNRS/INSU with INC/INP co-funded by CEA and CNES. This research is based in large part on observations obtained at the international Gemini Observatory, a program of NSF’s NOIRLab, which is managed by the Association of Universities for Research in Astronomy (AURA) under a cooperative agreement with the National Science Foundation, on behalf of the Gemini Observatory partnership: the National Science Foundation (United States), National Research Council (Canada), Agencia Nacional de Investigación y Desarrollo (Chile), Ministerio de Ciencia, Tecnología e Innovación (Argentina), Ministério da Ciência, Tecnologia, Inovações e Comunicações (Brazil), and Korea Astronomy and Space Science Institute (Republic of Korea).
References
- Bain, R. A., & Bardsley, J. N. 1972, J. Phys. B Atomic Mol. Phys., 5, 277 [NASA ADS] [CrossRef] [Google Scholar]
- Burton, M. G., Brand, P. W. J. L., Geballe, T. R., & Webster, A. S. 1989, MNRAS, 236, 409 [NASA ADS] [CrossRef] [Google Scholar]
- Burton, M. G., Bulmer, M., Moorhouse, A., Geballe, T. R., & Brand, P. W. J. L. 1992, MNRAS, 257, 1 [Google Scholar]
- Czachorowski, P., Puchalski, M., Komasa, J., & Pachucki, K. 2018, Phys. Rev. A, 98, 052506 [NASA ADS] [CrossRef] [Google Scholar]
- Fernandes, A. J. L., & Brand, P. W. J. L. 1995, MNRAS, 274, 639 [NASA ADS] [CrossRef] [Google Scholar]
- Garden, R. P., Russell, A. P. G., & Burton, M. G. 1990, ApJ, 354, 232 [NASA ADS] [CrossRef] [Google Scholar]
- Geballe, T. R., Burton, M. G., & Pike, R. E. 2017, ApJ, 837, 83 [NASA ADS] [CrossRef] [Google Scholar]
- Giannini, T., Antoniucci, S., Nisini, B., Bacciotti, F., & Podio, L. 2015, ApJ, 814, 52 [NASA ADS] [CrossRef] [Google Scholar]
- Hartigan, P., Curiel, C., & Raymond, J. 1989, ApJ, 347, L31 [NASA ADS] [CrossRef] [Google Scholar]
- Hartigan, P., Holcomb, R., & Frank, A. 2019, ApJ, 876, 147 [Google Scholar]
- Hölsch, N., Beyer, M., Salumbides, E. J., et al. 2019, Phys. Rev. Lett., 122, 103002 [CrossRef] [Google Scholar]
- Kaplan, K. F., Dinerstein, H. L., Kim, H., & Jaffe, D. T. 2021, ApJ, 919, 27 [NASA ADS] [CrossRef] [Google Scholar]
- Martin, P. G., Schwarz, D. H., & Mandy, M. E. 1996, ApJ, 461, 265 [NASA ADS] [CrossRef] [Google Scholar]
- McCartney, M. S. K., Brand, P. W. J. L., Burton, M. G., & Chrysostomou, A. 1999, MNRAS, 307, 315 [NASA ADS] [CrossRef] [Google Scholar]
- McGregor, P. J., Hart, J., Conroy, P. G., et al. 2003, in Instrument Design and Performance for Optical/Infrared Ground-based Telescopes, eds. M. Iye, & A. F. M. Moorwood , SPIE Conf. Ser., 4841, 1581 [NASA ADS] [CrossRef] [Google Scholar]
- Molinari, S., Noriega-Crespo, A., Ceccarelli, C., et al. 2000, ApJ, 538, 698 [NASA ADS] [CrossRef] [Google Scholar]
- Neufeld, D. A., Melnick, G. J., Sonnentrucker, P., et al. 2006, ApJ, 649, 816 [NASA ADS] [CrossRef] [Google Scholar]
- Neufeld, D. A., DeWitt, C., Lesaffre, P., et al. 2019, ApJ, 878, L18 [NASA ADS] [CrossRef] [Google Scholar]
- Pike, R. E., Geballe, T. R., Burton, M. G., & Chrysostomou, A. 2016, ApJ, 822, 82 [NASA ADS] [CrossRef] [Google Scholar]
- Roueff, E. M., & Abgrall, H. 2022, Mol. Phys., e2122887 [CrossRef] [Google Scholar]
- Schwenke, D. W. 1988, Theoret. Chim. Acta, 74, 381 [NASA ADS] [CrossRef] [Google Scholar]
- Selg, M. 2010, Mol. Phys., 108, 687 [NASA ADS] [CrossRef] [Google Scholar]
- Solf, J., & Boehm, K. H. 1987, AJ, 93, 1172 [NASA ADS] [CrossRef] [Google Scholar]
- Sperling, T., Eislöffel, J., Fischer, C., et al. 2020, A&A, 642, A216 [CrossRef] [EDP Sciences] [Google Scholar]
- Strom, S. E., Vrba, F. J., & Strom, K. M. 1976, AJ, 81, 314 [Google Scholar]
- Tiesinga, E., Mohr, P. J., Newell, D. B., & Taylor, B. N. 2021, J. Phys. Chem. Ref. Data, 50, 033105 [NASA ADS] [CrossRef] [Google Scholar]
- Yuan, Y., & Neufeld, D. A. 2011, ApJ, 726, 76 [NASA ADS] [CrossRef] [Google Scholar]
- Zealey, W. J., Williams, P. M., & Sandell, G. 1984, A&A, 140, L31 [NASA ADS] [Google Scholar]
- Zúñiga, J., Bastida, A., Requena, A., & Cerezo, J. 2021, J. Phys. Chem. A, 9226 [Google Scholar]
All Tables
Properties of the two detected quasi-bound levels, v = 2, J = 29 and v = 1, J = 31, of H2 and their emission spectrum.
All Figures
|
Fig. 1. Observational data showing highly excited H2 lines in HH7. Top two panels: spectra of a 0 |
| In the text | |
|
Fig. 2. H2 molecular potentials in eV as a function of the interatomic distance, R, expressed in atomic units. The zero value corresponds to photo-dissociated H2. The black curve is the electronic potential of the |
| In the text | |
|
Fig. 3. Level column densities, divided by their degeneracies, Ni/gi, plotted as a function of level energy, Ti, for the H2 lines measured in HH7. They are normalised to unity for the (v, J)=(1, 3) upper-state level at 6952 K, which emits the 1–0 S(1) line. The two blue points (in the lower right) are for the newly analysed 2–1 S(27) and 1–0 S(29) lines. The dashed red line shows the best two-temperature LTE fit, as described in Sect. 4. |
| In the text | |
Current usage metrics show cumulative count of Article Views (full-text article views including HTML views, PDF and ePub downloads, according to the available data) and Abstracts Views on Vision4Press platform.
Data correspond to usage on the plateform after 2015. The current usage metrics is available 48-96 hours after online publication and is updated daily on week days.
Initial download of the metrics may take a while.