Fig. 1.
Download original image
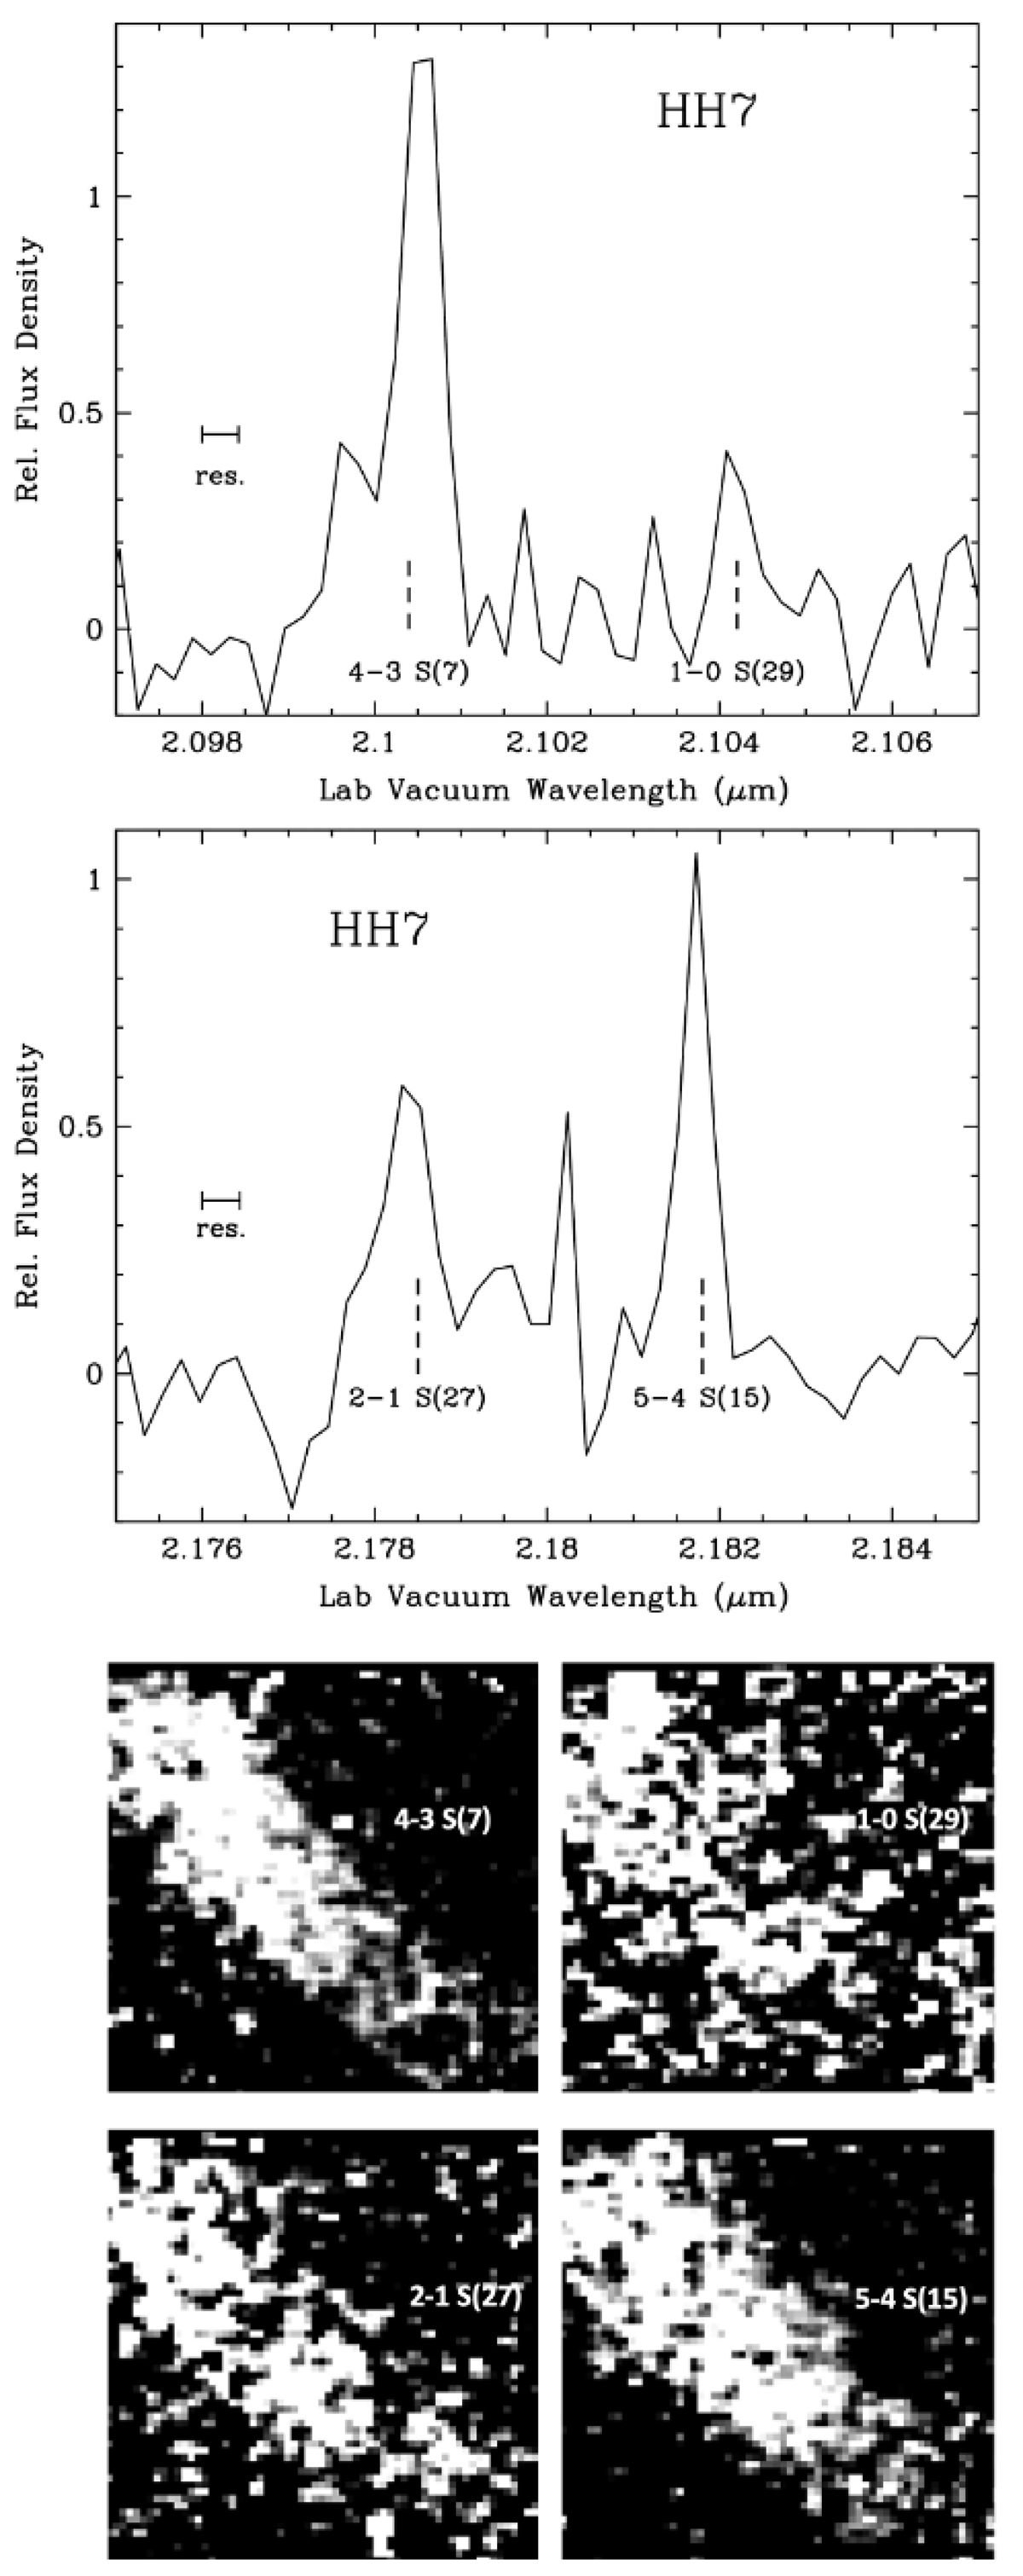
Observational data showing highly excited H2 lines in HH7. Top two panels: spectra of a 0![]() 6 × 0
6 × 0![]() 9 area of HH7 in two narrow wavelength intervals, each containing a line of H2 from a quasi-bound energy level and one adjacent line, from Fig. 6 of P16. Vertical dashed lines are the line wavelengths calculated as described in Sect. 3. Bottom: spectral images of the four lines shown above, extracted from the NIFS data cube. The field of view is 2
9 area of HH7 in two narrow wavelength intervals, each containing a line of H2 from a quasi-bound energy level and one adjacent line, from Fig. 6 of P16. Vertical dashed lines are the line wavelengths calculated as described in Sect. 3. Bottom: spectral images of the four lines shown above, extracted from the NIFS data cube. The field of view is 2![]() 5 × 2
5 × 2![]() 5 and corresponds to the left part of Fig. 2 of P16; the field centre corresponds to RA = 3:29:08.42, Dec = +31:15:27:45 (J2000), with an estimated uncertainty of 0
5 and corresponds to the left part of Fig. 2 of P16; the field centre corresponds to RA = 3:29:08.42, Dec = +31:15:27:45 (J2000), with an estimated uncertainty of 0![]() 25.
25.
Current usage metrics show cumulative count of Article Views (full-text article views including HTML views, PDF and ePub downloads, according to the available data) and Abstracts Views on Vision4Press platform.
Data correspond to usage on the plateform after 2015. The current usage metrics is available 48-96 hours after online publication and is updated daily on week days.
Initial download of the metrics may take a while.